On chart:
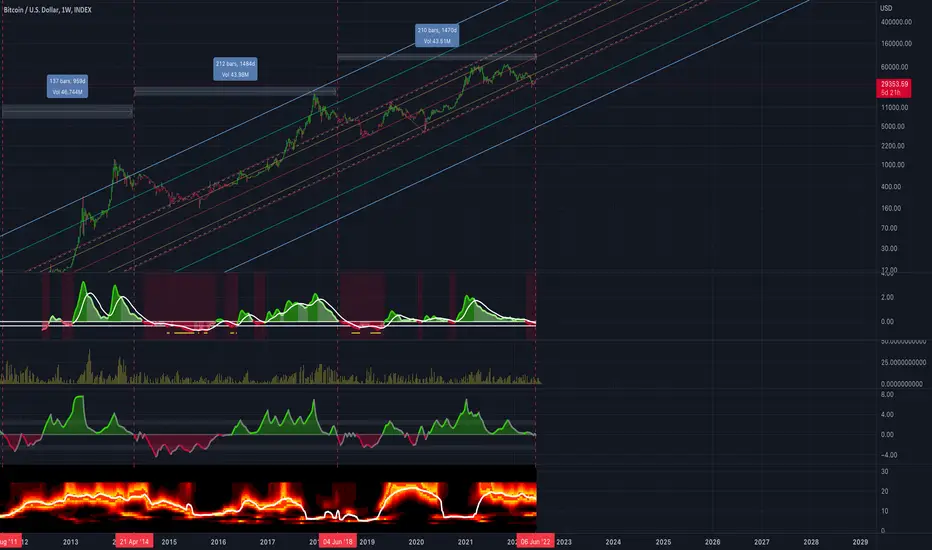
Cycle Adaptive Volatility Meter: Autocorrelation Dominant Cycle Adaptive Volatility by TRD (True Range Double) to correct for volatility skew
GARCH: Projected Standard deviation %, 6 week forward projection
Fisher Cycle Adaptive, Fisher Transform: Mean Reversion
Autocorrelation Periodogram: Measure of cycle dominance with price-to-cycle fitness, current cycle length = 16 weeks
Volatility is dumping, mean of price already 2 weeks inside danger zone, last week was small relief, standard deviation % forward projection pointed downward
Conclusion: Perilous times ahead, only positive here is that price is sitting on bottom of Pitch Fork in Log at 99.7% stop which could mean we whipsaw back to the mean; however, lots of confluence pointing to further down from here--matching past full bear-to-bull. Bear-to-bull cycles used to attempt to capture when BTC bottom is in to ride next cycle bottom to next cycle top. Assuming our GARCH projection holds, and we continue downward, we might get some action here with a standard deviation squeeze
Ghi chú
Bear case: We follow past cycles into the abyss, this time breaking the 11-year log trendBull case: We pump off SD squeeze and 99.7% band from last impulse from bear cycle and maintain 11 year log trend
Public Telegram Group, t.me/algxtrading_public
VIP Membership Info: patreon.com/algxtrading/membership
VIP Membership Info: patreon.com/algxtrading/membership
Thông báo miễn trừ trách nhiệm
Thông tin và các ấn phẩm này không nhằm mục đích, và không cấu thành, lời khuyên hoặc khuyến nghị về tài chính, đầu tư, giao dịch hay các loại khác do TradingView cung cấp hoặc xác nhận. Đọc thêm tại Điều khoản Sử dụng.