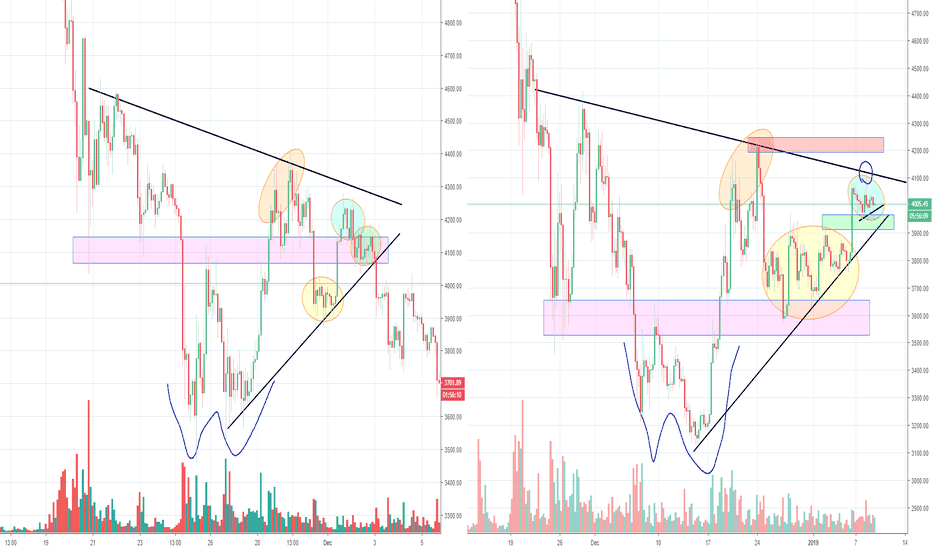
When i posted the previous one, at first i thought, really??? Would it?? Noooo, but it looks so much alike :). Anyway, now it looks even scarier, as i showed in my last update about the black circle, it's moving exactly the same ( bull flag ) AND' also at that red resistance.
Anyway, this pattern suggest we see another move up and then seeing some bigger corrections. Actually, this falls perfectly in line with my last Bitcoin analysis, that blue line. So suggesting a break up to 4100/4150 and then making a bigger correction in price and time, before gathering strength for an attack of the big 4200 resistance.

Fractals play out very nicely sometimes, but not always. A year ago they were huge winners most of the time, as my early followers probably remember, but the past 6/8 months they have become less reliable. The biggest reason is probably the low volume . So try to find your own confirmation as well. For the more actual TA, follow my normal Bitcoin' analysis.
Don't forget to like if you appreciate this :)
Previous analysis:

Few other recent fractals.


Anyway, this pattern suggest we see another move up and then seeing some bigger corrections. Actually, this falls perfectly in line with my last Bitcoin analysis, that blue line. So suggesting a break up to 4100/4150 and then making a bigger correction in price and time, before gathering strength for an attack of the big 4200 resistance.
Fractals play out very nicely sometimes, but not always. A year ago they were huge winners most of the time, as my early followers probably remember, but the past 6/8 months they have become less reliable. The biggest reason is probably the low volume . So try to find your own confirmation as well. For the more actual TA, follow my normal Bitcoin' analysis.
Don't forget to like if you appreciate this :)
Previous analysis:

Few other recent fractals.


Thông báo miễn trừ trách nhiệm
Thông tin và ấn phẩm không có nghĩa là và không cấu thành, tài chính, đầu tư, kinh doanh, hoặc các loại lời khuyên hoặc khuyến nghị khác được cung cấp hoặc xác nhận bởi TradingView. Đọc thêm trong Điều khoản sử dụng.
Thông báo miễn trừ trách nhiệm
Thông tin và ấn phẩm không có nghĩa là và không cấu thành, tài chính, đầu tư, kinh doanh, hoặc các loại lời khuyên hoặc khuyến nghị khác được cung cấp hoặc xác nhận bởi TradingView. Đọc thêm trong Điều khoản sử dụng.
