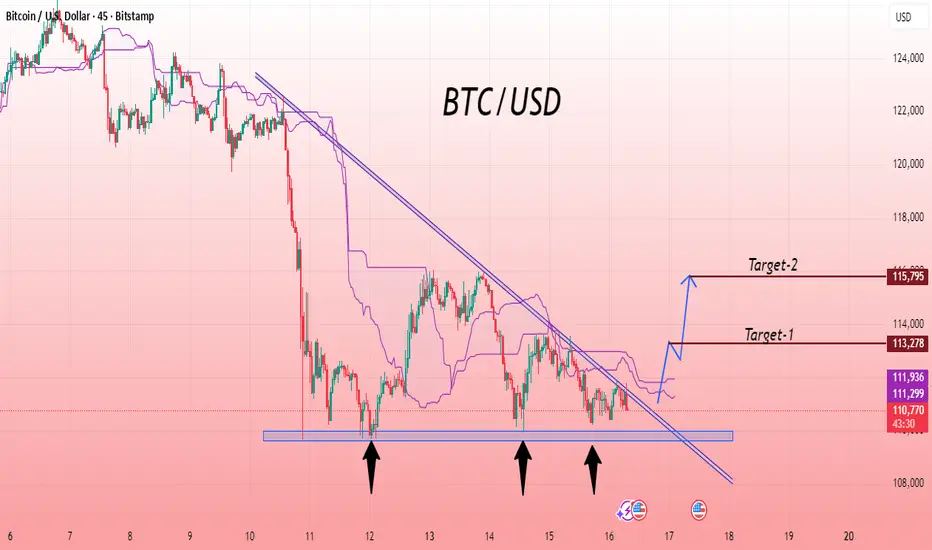
The Bitcoin/USD chart illustrates a strong accumulation phase forming near a significant support area, shown by multiple rebounds marked with arrows. Each retest of this zone demonstrates that buyers are actively defending the level, preventing further downside movement. A clear descending trendline reveals consistent selling pressure; however, recent candles indicate that bearish momentum is losing strength. This repeated defense at the bottom suggests growing buyer interest and potential preparation for a bullish reversal. If price manages to close above the descending line, it may confirm a shift in market sentiment from selling to buying. Overall, the chart reflects stabilization after a prolonged decline, with increasing signs that buyers are gradually regaining control over the market direction.
Entry Zone: Buy
🎯 Target 1 : 113,270
🎯 Target 2 : 115,795
If you found this analysis helpful, don’t forget to drop a like and comment. Your support keeps quality ideas flowing—let’s grow and win together! 💪📈
Entry Zone: Buy
🎯 Target 1 : 113,270
🎯 Target 2 : 115,795
If you found this analysis helpful, don’t forget to drop a like and comment. Your support keeps quality ideas flowing—let’s grow and win together! 💪📈
Giao dịch đang hoạt động
Thông báo miễn trừ trách nhiệm
Thông tin và các ấn phẩm này không nhằm mục đích, và không cấu thành, lời khuyên hoặc khuyến nghị về tài chính, đầu tư, giao dịch hay các loại khác do TradingView cung cấp hoặc xác nhận. Đọc thêm tại Điều khoản Sử dụng.
Thông báo miễn trừ trách nhiệm
Thông tin và các ấn phẩm này không nhằm mục đích, và không cấu thành, lời khuyên hoặc khuyến nghị về tài chính, đầu tư, giao dịch hay các loại khác do TradingView cung cấp hoặc xác nhận. Đọc thêm tại Điều khoản Sử dụng.