Hi Traders,
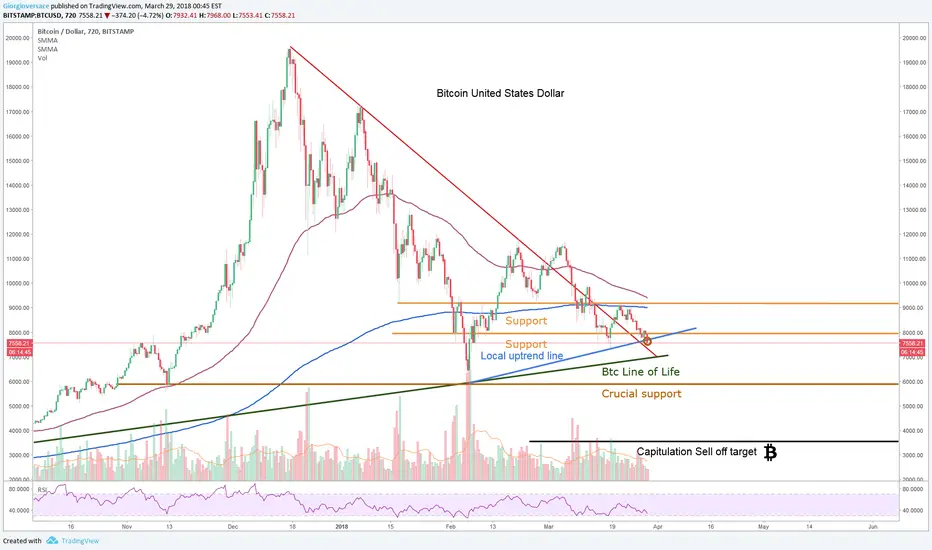
As i expected since very long weeks, Bitcoin is about to test its line of life, this line is the life of the Bubble rallye starting pattern since around last May.
Bitcoin just broke below the very important local line formed since the low of february (blue line), this means we have extremely high probabilities of heading towards the line of life.
I expect a bounce of Btc around this area (around 7k) it is normally rational to expect an upward movement around this zone as Btc bubble burst is still not over, so it has to test its own life and react to its testing.
This could open possible swing trades, or day trades depending on how much it reacts around this zone.
If Bitcoin does not bounce around this line of life, which is possible but not likely, i would expect Bitcoin to form a double bottom reactive bounce with the February low (around the 6k zone).
If Bitcoin ends up breaking below its line of life, and below its crucial support, i expect a rational economic bubble capitulation sell-off phase to occur.
Good luck and stay safe with your money, trading in a bursting bubble process is extremely risky unless you are shorting at right times.
Ghi chú
Quick analysis of the 1 min chart to dissect what is happening very locally.
Still no natural human volume following the artificial pumps.
Clearly : this means, almost no buyers at this Bitcoin value range.
Ghi chú
This moment is going to be interesting: Bitcoin is very close to test its own life lineGhi chú
Party starting.Ghi chú
Right when it touched the line of life start at 7.020Magics of charts lol
Ghi chú
Giao dịch đang hoạt động
The bubble just officially burst
Ghi chú
Possibly a similar pattern forming, which would indicate some more raise to around 7500, then a further drop to the 5800 area.
We have to see how it evolves to confirm the similarity in this pattern, it is a possibility
Ghi chú
Just as a reminder, we only are 3000$ away from the capitulation sell-off target priceGhi chú
This graph is fascinating me by the quickness of its brutal crash, i never seen such a fast burst in my life.
I red some TAs in here, where traders are projecting a 12k/13k bulltrap for in a few days, and 100.000$ for 2018.
I want to cry laughing when i read these sort of random millenial TAs, (i am actually surprised by the number of views they have) but i am actually not laughing as they are probably making other persons losing money, and this is sad
Ghi chú
Local dips are followed by lower raises, not a good sign yet
Ghi chú
Lower raises and lower volumes...Which means 6400-6900$ is too expensive for 1 Btc according to the current market sentiment
Thông báo miễn trừ trách nhiệm
Thông tin và ấn phẩm không có nghĩa là và không cấu thành, tài chính, đầu tư, kinh doanh, hoặc các loại lời khuyên hoặc khuyến nghị khác được cung cấp hoặc xác nhận bởi TradingView. Đọc thêm trong Điều khoản sử dụng.
Thông báo miễn trừ trách nhiệm
Thông tin và ấn phẩm không có nghĩa là và không cấu thành, tài chính, đầu tư, kinh doanh, hoặc các loại lời khuyên hoặc khuyến nghị khác được cung cấp hoặc xác nhận bởi TradingView. Đọc thêm trong Điều khoản sử dụng.