Technical Pattern: Support Confirmed + Oversold Recovery, Bullish Momentum Accumulating
The $92,000 level lies in a critical technical support zone, with multiple signals resonating:
- On the daily chart, the RSI has rebounded from the oversold zone (34) to 51, moving out of the weak range while remaining below the overbought threshold — leaving ample room for further upside.
- The MACD green histogram continues to narrow, with the fast and slow lines approaching a golden cross, indicating a gradual exhaustion of selling pressure.
Solid Support System
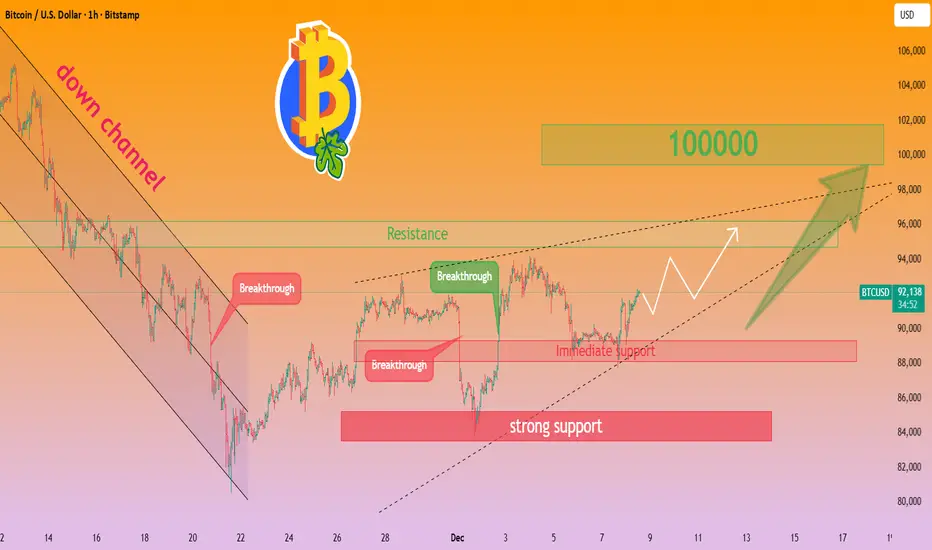
- Immediate support: $90,000–$91,000 (recent high-volume trading cluster), where concentrated trading activity forms a strong demand floor.
- Strong support: $88,000, a key on-chain accumulation zone and JPMorgan’s estimated "soft cost-of-production bottom." This dual support provides a robust safety margin for bullish positions.
Resistance & Upside Potential
Focus on the $93,000–$95,000 resistance range. A valid breakthrough will open up rebound space toward $98,000–$100,000. Currently, the price is in an advantageous layout zone characterized by "clear support + accessible resistance," with accumulating bullish momentum setting the stage for a potential rally.
Bitcoin trading strategy
buy:91000-92000
tp:93000-95000-98000
sl:90000
The $92,000 level lies in a critical technical support zone, with multiple signals resonating:
- On the daily chart, the RSI has rebounded from the oversold zone (34) to 51, moving out of the weak range while remaining below the overbought threshold — leaving ample room for further upside.
- The MACD green histogram continues to narrow, with the fast and slow lines approaching a golden cross, indicating a gradual exhaustion of selling pressure.
Solid Support System
- Immediate support: $90,000–$91,000 (recent high-volume trading cluster), where concentrated trading activity forms a strong demand floor.
- Strong support: $88,000, a key on-chain accumulation zone and JPMorgan’s estimated "soft cost-of-production bottom." This dual support provides a robust safety margin for bullish positions.
Resistance & Upside Potential
Focus on the $93,000–$95,000 resistance range. A valid breakthrough will open up rebound space toward $98,000–$100,000. Currently, the price is in an advantageous layout zone characterized by "clear support + accessible resistance," with accumulating bullish momentum setting the stage for a potential rally.
Bitcoin trading strategy
buy:91000-92000
tp:93000-95000-98000
sl:90000
💹💹💹Trading strategies and analysis: Gold, BTC, crude oil, foreign exchange, etc.
📶📶📶Free trading signals:t.me/+EbXVM-CStnFmNjBk
📶📶📶Free trading signals:t.me/+EbXVM-CStnFmNjBk
Thông báo miễn trừ trách nhiệm
Thông tin và các ấn phẩm này không nhằm mục đích, và không cấu thành, lời khuyên hoặc khuyến nghị về tài chính, đầu tư, giao dịch hay các loại khác do TradingView cung cấp hoặc xác nhận. Đọc thêm tại Điều khoản Sử dụng.