https://www.tradingview.com/x/S3xhWLRG/
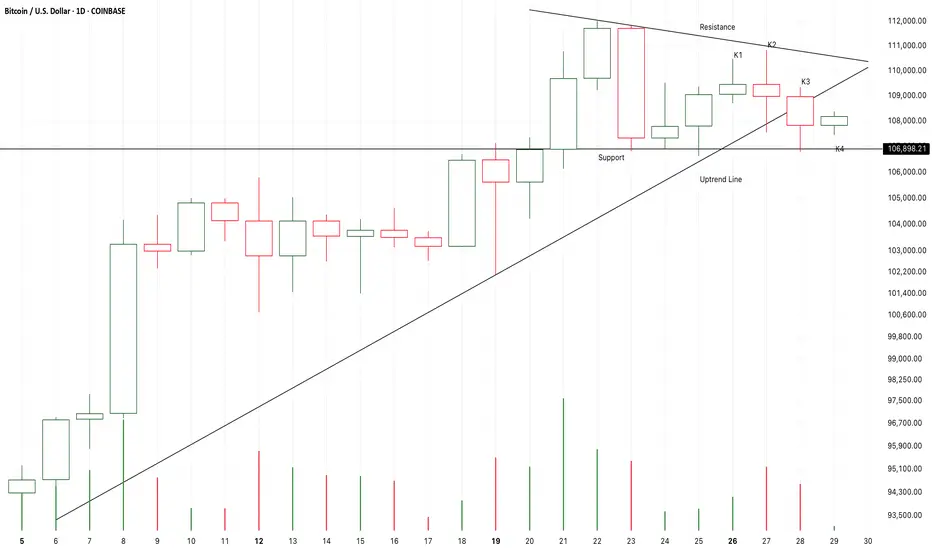
K3 is a weak break down,
It failed to close below K2.
It seems that K4 will test the uptrend line to verify K3 was a fake down or not.
If K4 close upon K3,
Another bull run will start here to test 112K area.
If K4 or K5 are doji candles around the support,
It is likely that a sharp price correction will start here to test 102K area.
Ghi chú
K5 and K6 are two bullish candles,
It seems that K6 will close upon or near the resistance.
The supply pressure keeps decreasing.
All of this are good signals for the bull market.
On the other hand,
The candle body of K6 is still too small,
It couldn’t verify the strong bullish momentum,
K7 must accelerate to break up to verify the strong market,
If not,
I will expecte a 3-4 weeks consolidation around the resisitance and then break up to test 120K area.
I don’t think it is a good idea to short it here with heavy positions.
Perhaps after two months,
The three years bull market will get to its time limit.
Thông báo miễn trừ trách nhiệm
Thông tin và ấn phẩm không có nghĩa là và không cấu thành, tài chính, đầu tư, kinh doanh, hoặc các loại lời khuyên hoặc khuyến nghị khác được cung cấp hoặc xác nhận bởi TradingView. Đọc thêm trong Điều khoản sử dụng.
Thông báo miễn trừ trách nhiệm
Thông tin và ấn phẩm không có nghĩa là và không cấu thành, tài chính, đầu tư, kinh doanh, hoặc các loại lời khuyên hoặc khuyến nghị khác được cung cấp hoặc xác nhận bởi TradingView. Đọc thêm trong Điều khoản sử dụng.