Technical Analysis of Bitcoin (BTC/USDT) – Daily Chart
1. Trendline (Key Resistance):
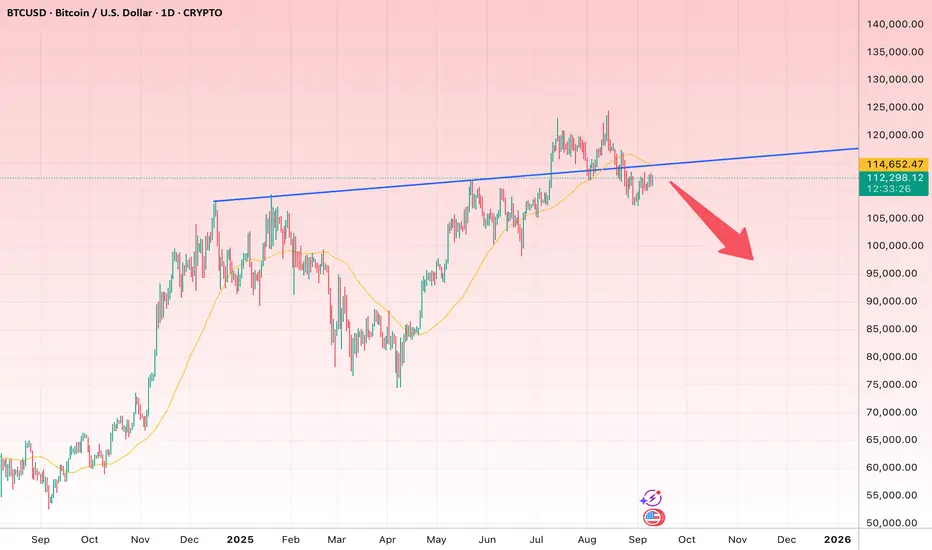
o A major ascending trendline (blue) that previously acted as a strong resistance has once again turned into dynamic resistance.
o After a failed breakout above this trendline, price slipped back below it — a clear sign of weakening bullish momentum.
2. Moving Average (MA50):
o The 50-day moving average is visible on the chart.
o Bitcoin is currently trading below this MA, which strengthens bearish pressure in the short term.
3. Market Structure:
o After topping around $131,700, BTC entered a corrective phase.
o Lower highs and lower lows are gradually forming, pointing to the emergence of a short-term downtrend.
4. Bearish Signals:
o Failed retest of the broken trendline.
o Price rejection near the MA50.
o A potential bearish divergence (if checked with RSI).
o The red arrow on the chart suggests further downside pressure.
5. Key Levels to Watch:
o Resistance Zone: $114,500 – $118,000 (trendline + MA50).
o First Support: $100,000 – $103,000.
o Second Support: $95,000 – $97,000.
o Critical Support: $90,000.
6. Possible Scenarios:
o If Bitcoin fails to reclaim and hold above $114,500 – $118,000, the path toward $100K and even $95K remains open.
o A decisive breakout and strong close above $118K would invalidate the bearish bias and could trigger another rally toward the $130K region.
Conclusion:
At this stage, Bitcoin is showing more bearish than bullish signals. The failed breakout above the trendline and rejection below the MA50 increase the probability of a deeper correction. Unless BTC regains strength above the $114.5K–$118K resistance, downside targets at $100K and $95K look more likely.
1. Trendline (Key Resistance):
o A major ascending trendline (blue) that previously acted as a strong resistance has once again turned into dynamic resistance.
o After a failed breakout above this trendline, price slipped back below it — a clear sign of weakening bullish momentum.
2. Moving Average (MA50):
o The 50-day moving average is visible on the chart.
o Bitcoin is currently trading below this MA, which strengthens bearish pressure in the short term.
3. Market Structure:
o After topping around $131,700, BTC entered a corrective phase.
o Lower highs and lower lows are gradually forming, pointing to the emergence of a short-term downtrend.
4. Bearish Signals:
o Failed retest of the broken trendline.
o Price rejection near the MA50.
o A potential bearish divergence (if checked with RSI).
o The red arrow on the chart suggests further downside pressure.
5. Key Levels to Watch:
o Resistance Zone: $114,500 – $118,000 (trendline + MA50).
o First Support: $100,000 – $103,000.
o Second Support: $95,000 – $97,000.
o Critical Support: $90,000.
6. Possible Scenarios:
o If Bitcoin fails to reclaim and hold above $114,500 – $118,000, the path toward $100K and even $95K remains open.
o A decisive breakout and strong close above $118K would invalidate the bearish bias and could trigger another rally toward the $130K region.
Conclusion:
At this stage, Bitcoin is showing more bearish than bullish signals. The failed breakout above the trendline and rejection below the MA50 increase the probability of a deeper correction. Unless BTC regains strength above the $114.5K–$118K resistance, downside targets at $100K and $95K look more likely.
Thông báo miễn trừ trách nhiệm
Thông tin và ấn phẩm không có nghĩa là và không cấu thành, tài chính, đầu tư, kinh doanh, hoặc các loại lời khuyên hoặc khuyến nghị khác được cung cấp hoặc xác nhận bởi TradingView. Đọc thêm trong Điều khoản sử dụng.
Thông báo miễn trừ trách nhiệm
Thông tin và ấn phẩm không có nghĩa là và không cấu thành, tài chính, đầu tư, kinh doanh, hoặc các loại lời khuyên hoặc khuyến nghị khác được cung cấp hoặc xác nhận bởi TradingView. Đọc thêm trong Điều khoản sử dụng.