I first drew this chart back in 2024 and it is amaxing how things have played out,
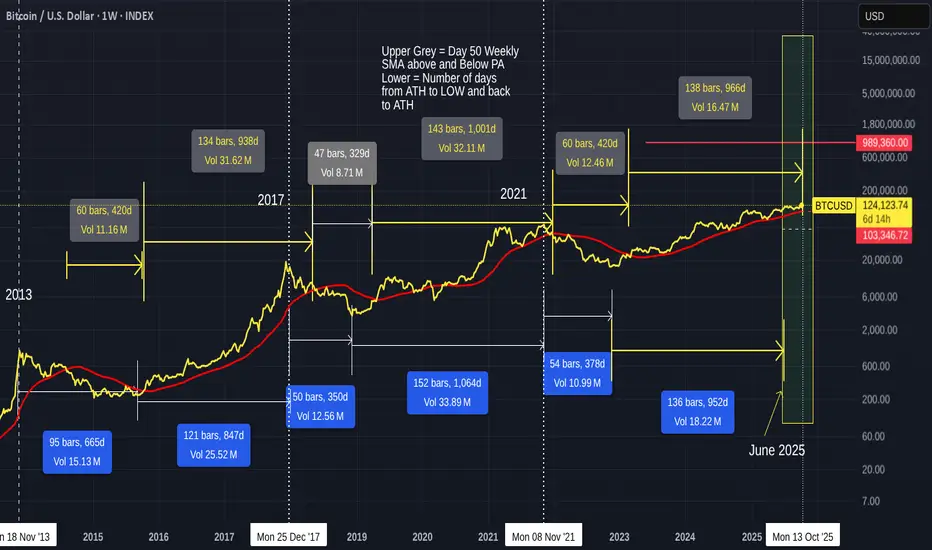
The Numbers in Grey boxes are the number of Days the 50 SMA ( red) has been above and below PA.
The Blue, Below PA is the day count for PA Cycle High to cycle Low and Back to Cycle high.
We have already past the "High Low" Day count for this cycle ATH and we are now on the Zone for the 50 SMA day count ATH. The peojected date for this ATH is 13 October.
Note how Similar PA & 50 SMA is in the 2013 - 2017 Cycle.
I was also running a PA Fractal chart showing similarities to PA and we can see how close it was until February this year

For me, the reason we went "Flat" from February onwards is simly because of the Long Term resistance over head.... a line that has rejected EVERY Bitcoin ATH = this is all explained in previous posts. See the Blue Arc.

It is that Blue Arc we need to Cross over. This Arc has kept PA Flat this cycle......
Looking at a Zoomed in Chart, we can see how that 50 SMA is a line of strong support.

Should PA retreat, the 50 SMA is at around 103K at this time.
The MACD is just under but in a zone where PA has retreated from

This does NOT automatical Mean PA will Drop from here. Though on lower Time Frames, MACD is up High in Oversold.
However, as the 4 hour shows us, It is already dropping from OverSold and yet PA has hit a high

Divergence is in play
One thing that dies hint at a pull back is the RSI being up in Oversold on a Daily chart

But it should be understood, RSI Can range High or Low
So, are we in Cycle Still ?
If we are, we should expect a beginning of a BEAR market in the next few weeks. But we have not really seen the "Top" pattern and Profit taking yet.....
Until that happens, I really am inclined to believe we have broken the cycle patterns.for a number of reasons.
For instance, the MVRV Z Score

This has not even past the levels seen in previous Runs
BUT as a precaution, it is worth noting that Dash orange line, that starts where the Nov 2021 ATH Was.
We have been rejected from that level already this run But we Still have room to get back up to that level at the mooment.
The Main reason i feel things are different are that Blue Arc I mentioned earlier.
We HAVE to break above that and remain there.....
We are too close at this moment and a Bear market WILL take us back below that HUGE line of Very Very Strong resistance. The Daily chart below shows this

We need one more push to take us Higher, to give us Room to remain above, even when Bitcoin Does correct .
Note that 3 Fin extension on the last chart posted.
We just got above the 6. We need to Rise far enough over that for it to act as support ewhn retested.
3, 6, 9
9 Fib extension at around 180K
Just saying
NEW CYCLES ARE BEGINNING
The Numbers in Grey boxes are the number of Days the 50 SMA ( red) has been above and below PA.
The Blue, Below PA is the day count for PA Cycle High to cycle Low and Back to Cycle high.
We have already past the "High Low" Day count for this cycle ATH and we are now on the Zone for the 50 SMA day count ATH. The peojected date for this ATH is 13 October.
Note how Similar PA & 50 SMA is in the 2013 - 2017 Cycle.
I was also running a PA Fractal chart showing similarities to PA and we can see how close it was until February this year
For me, the reason we went "Flat" from February onwards is simly because of the Long Term resistance over head.... a line that has rejected EVERY Bitcoin ATH = this is all explained in previous posts. See the Blue Arc.
It is that Blue Arc we need to Cross over. This Arc has kept PA Flat this cycle......
Looking at a Zoomed in Chart, we can see how that 50 SMA is a line of strong support.
Should PA retreat, the 50 SMA is at around 103K at this time.
The MACD is just under but in a zone where PA has retreated from
This does NOT automatical Mean PA will Drop from here. Though on lower Time Frames, MACD is up High in Oversold.
However, as the 4 hour shows us, It is already dropping from OverSold and yet PA has hit a high
Divergence is in play
One thing that dies hint at a pull back is the RSI being up in Oversold on a Daily chart
But it should be understood, RSI Can range High or Low
So, are we in Cycle Still ?
If we are, we should expect a beginning of a BEAR market in the next few weeks. But we have not really seen the "Top" pattern and Profit taking yet.....
Until that happens, I really am inclined to believe we have broken the cycle patterns.for a number of reasons.
For instance, the MVRV Z Score
This has not even past the levels seen in previous Runs
BUT as a precaution, it is worth noting that Dash orange line, that starts where the Nov 2021 ATH Was.
We have been rejected from that level already this run But we Still have room to get back up to that level at the mooment.
The Main reason i feel things are different are that Blue Arc I mentioned earlier.
We HAVE to break above that and remain there.....
We are too close at this moment and a Bear market WILL take us back below that HUGE line of Very Very Strong resistance. The Daily chart below shows this
We need one more push to take us Higher, to give us Room to remain above, even when Bitcoin Does correct .
Note that 3 Fin extension on the last chart posted.
We just got above the 6. We need to Rise far enough over that for it to act as support ewhn retested.
3, 6, 9
9 Fib extension at around 180K
Just saying
NEW CYCLES ARE BEGINNING
Nothing to be taken as Financial advice.
I will always say
"Only invest what you can afford to loose. When you are ready, take out your original investment. This way, it is only your profit that is at risk"
THAT is Financial advice
I will always say
"Only invest what you can afford to loose. When you are ready, take out your original investment. This way, it is only your profit that is at risk"
THAT is Financial advice
Thông báo miễn trừ trách nhiệm
Thông tin và ấn phẩm không có nghĩa là và không cấu thành, tài chính, đầu tư, kinh doanh, hoặc các loại lời khuyên hoặc khuyến nghị khác được cung cấp hoặc xác nhận bởi TradingView. Đọc thêm trong Điều khoản sử dụng.