Bitcoin Bounce or Breakdown? Watch These Key RSI + Fib Levels This Week ₿⚠
⸻
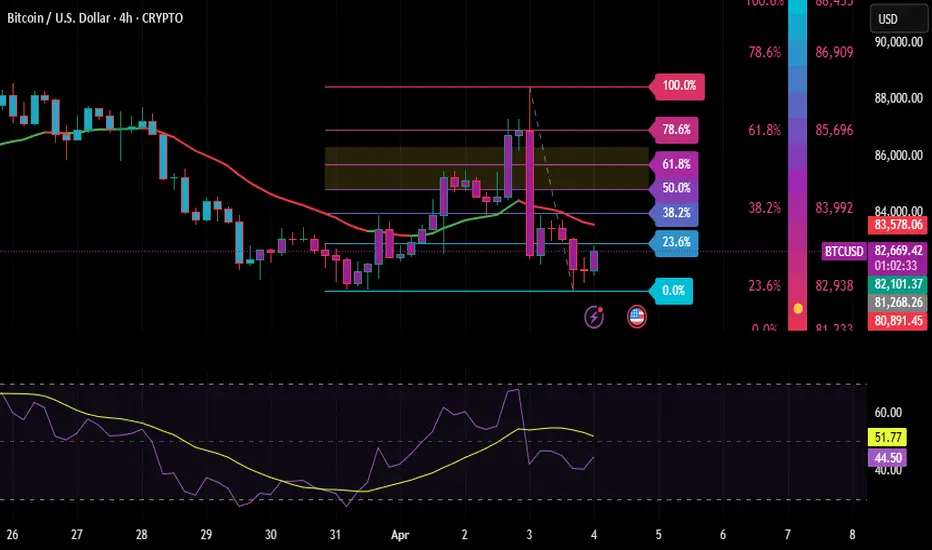
Bitcoin has pulled back from the 85,000–86,000 zone and is now hovering near the 23.6% Fibonacci retracement level. Using AutoFibGauge, QMA, and RSI, I’ve mapped out the key zones to watch for this week.
⸻
Key Levels from the Chart:
• 86,909 – 100% (swing high)
• 85,696 – 61.8% Fib
• 83,992 – 38.2% Fib
• 82,093 – 23.6% Fib (Currently reacting here)
• 81,298 – 0% Fib (Support base)
⸻
What I’m Watching:
• RSI is neutral (~52) but starting to tick upward — early bounce signs?
• If price holds above 82,000, we may see a move back to 83,900–85,600
• A breakdown below 81,300 could trigger deeper selling into the 80,000–78,000 zone
• QMA still shows bearish trend, so I’ll wait for structure confirmation before going long
⸻
This setup is based on Fib structure + RSI strength + QMA confirmation — a combo I’ve found highly reliable on BTC/USD.
⸻
LIKE ❤ & FOLLOW ➕ for more weekly crypto setups and pro strategies!
⸻
#BTCUSD #Bitcoin #CryptoStrategy #RSI #Fibonacci #AutoFibGauge #QMA #TechnicalAnalysis #PriceAction #BTCAnalysis
⸻
Bitcoin has pulled back from the 85,000–86,000 zone and is now hovering near the 23.6% Fibonacci retracement level. Using AutoFibGauge, QMA, and RSI, I’ve mapped out the key zones to watch for this week.
⸻
Key Levels from the Chart:
• 86,909 – 100% (swing high)
• 85,696 – 61.8% Fib
• 83,992 – 38.2% Fib
• 82,093 – 23.6% Fib (Currently reacting here)
• 81,298 – 0% Fib (Support base)
⸻
What I’m Watching:
• RSI is neutral (~52) but starting to tick upward — early bounce signs?
• If price holds above 82,000, we may see a move back to 83,900–85,600
• A breakdown below 81,300 could trigger deeper selling into the 80,000–78,000 zone
• QMA still shows bearish trend, so I’ll wait for structure confirmation before going long
⸻
This setup is based on Fib structure + RSI strength + QMA confirmation — a combo I’ve found highly reliable on BTC/USD.
⸻
LIKE ❤ & FOLLOW ➕ for more weekly crypto setups and pro strategies!
⸻
#BTCUSD #Bitcoin #CryptoStrategy #RSI #Fibonacci #AutoFibGauge #QMA #TechnicalAnalysis #PriceAction #BTCAnalysis
Thông báo miễn trừ trách nhiệm
Thông tin và ấn phẩm không có nghĩa là và không cấu thành, tài chính, đầu tư, kinh doanh, hoặc các loại lời khuyên hoặc khuyến nghị khác được cung cấp hoặc xác nhận bởi TradingView. Đọc thêm trong Điều khoản sử dụng.
Thông báo miễn trừ trách nhiệm
Thông tin và ấn phẩm không có nghĩa là và không cấu thành, tài chính, đầu tư, kinh doanh, hoặc các loại lời khuyên hoặc khuyến nghị khác được cung cấp hoặc xác nhận bởi TradingView. Đọc thêm trong Điều khoản sử dụng.