Giá xuống
Bitcoin 15-Min Chart – Lower Timeframe Structure of Higher Timef
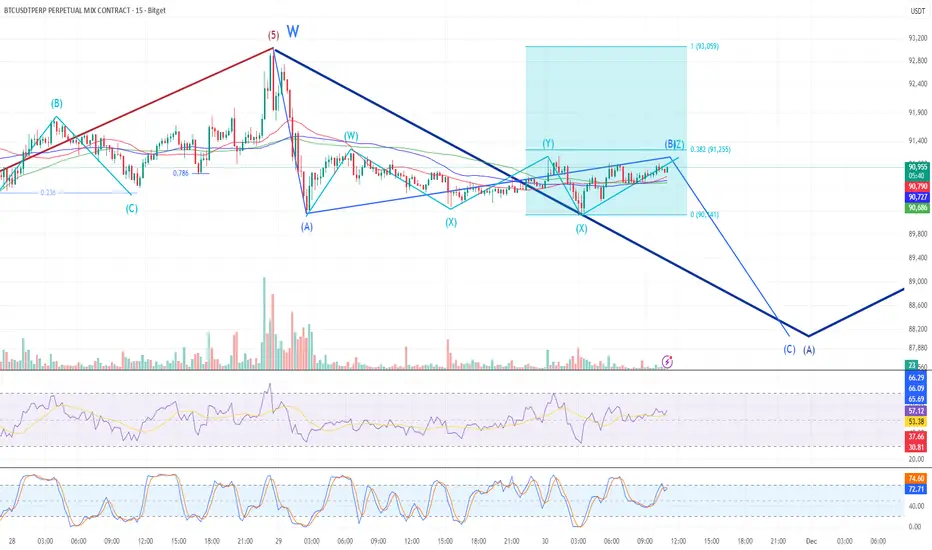
The higher timeframe ABC correction is being interpreted as a W-X-Y structure on the 15-minute chart, based on internal wave complexity.
Currently in the A wave of the internal ABC within the X leg
Within that A wave, a smaller ABC is unfolding, with the A-B portion nearing completion
Overall structure suggests a complex correction (W-X-Y-X-Z) in progress
At the moment, moving averages are tightly clustered, forming a combined support zone.
➡️ A clean break below this support cluster would strengthen the case for a Wave C move.
'규칙' & '패턴' 그리고 '조합'
blog.naver.com/lightvblue
blog.naver.com/lightvblue
Thông báo miễn trừ trách nhiệm
Thông tin và các ấn phẩm này không nhằm mục đích, và không cấu thành, lời khuyên hoặc khuyến nghị về tài chính, đầu tư, giao dịch hay các loại khác do TradingView cung cấp hoặc xác nhận. Đọc thêm tại Điều khoản Sử dụng.