BTCusdt — Descending Triangle. Preparing for a BTC Breakdown?
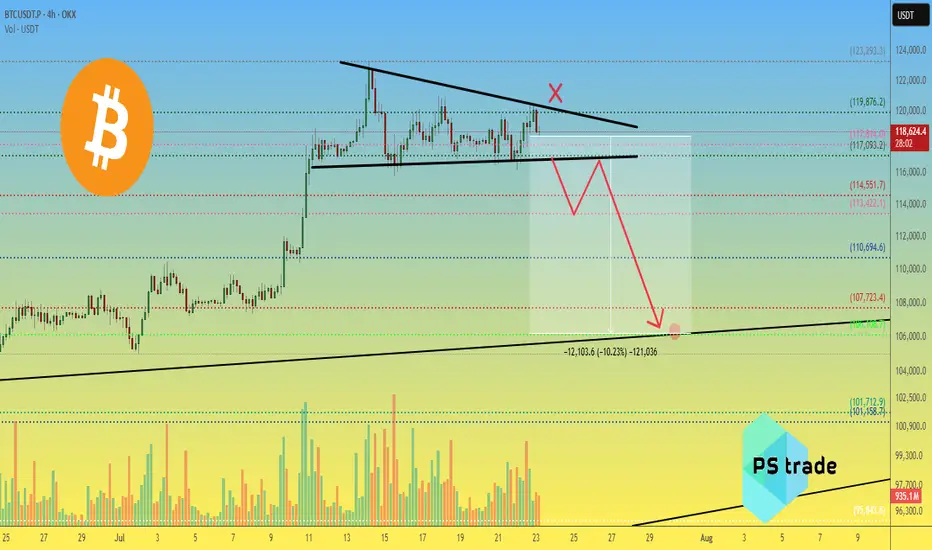
Price is being compressed under a descending trendline, and volume is steadily declining — a typical signal of an upcoming strong move.
📉 Downside target: $106,100 – $101,700
🔺 Invalidation: breakout above $119,876
📊 Key levels:
Resistance: $117000 / $113,500
Support: $110,694 / $107,723 / $106,108 / $101,712
⚠️ Pay attention — breakout is likely soon.
_____________________
Did you like our analysis? Leave a comment, like, and follow to get more
🎁 -20% for ALL trading fees at #OKX 👇
okx.com/join/20PSTRADE
🔥 V-I-P 👉 t.me/P_S_trade_menue_bot
🔵 Telegram 👉 t.me/pstrade_eng
🤖 Trading Bot 👉 copytrading.space/en/
📞 t.me/P_S_trades 📝
okx.com/join/20PSTRADE
🔥 V-I-P 👉 t.me/P_S_trade_menue_bot
🔵 Telegram 👉 t.me/pstrade_eng
🤖 Trading Bot 👉 copytrading.space/en/
📞 t.me/P_S_trades 📝
Bài đăng liên quan
Thông báo miễn trừ trách nhiệm
Thông tin và các ấn phẩm này không nhằm mục đích, và không cấu thành, lời khuyên hoặc khuyến nghị về tài chính, đầu tư, giao dịch hay các loại khác do TradingView cung cấp hoặc xác nhận. Đọc thêm tại Điều khoản Sử dụng.