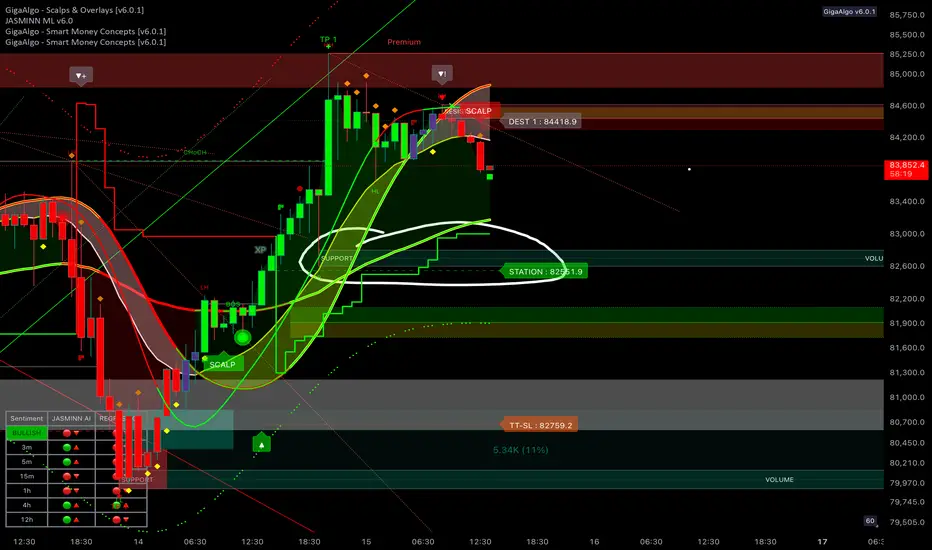
Bitcoin is currently in a pullback phase after reaching a local high, showing signs of short-term weakness. The price action reflects a clear upward trend supported by higher lows and strong buyer interest, but recent rejection at a resistance zone indicates profit-taking and potential short-term selling pressure.
A key support zone lies below the current price level, marked by increasing volume and a station level where buyers are likely to step in. If the price holds this support, a continuation of the bullish trend could follow, targeting the previous resistance zone. However, if the support fails, a deeper correction toward lower demand levels is possible.
Market sentiment is mixed — short-term signals show bullish strength, while higher timeframes remain cautious. The next key move depends on whether buyers defend the support zone and push through the overhead resistance. A confirmed breakout above resistance could drive the next upward leg, while a breakdown below support could shift momentum back to the bears.
Bài đăng liên quan
Thông báo miễn trừ trách nhiệm
Thông tin và ấn phẩm không có nghĩa là và không cấu thành, tài chính, đầu tư, kinh doanh, hoặc các loại lời khuyên hoặc khuyến nghị khác được cung cấp hoặc xác nhận bởi TradingView. Đọc thêm trong Điều khoản sử dụng.
Bài đăng liên quan
Thông báo miễn trừ trách nhiệm
Thông tin và ấn phẩm không có nghĩa là và không cấu thành, tài chính, đầu tư, kinh doanh, hoặc các loại lời khuyên hoặc khuyến nghị khác được cung cấp hoặc xác nhận bởi TradingView. Đọc thêm trong Điều khoản sử dụng.