Chart analysis for Bitcoin.
A view of Bitcoin, focusing on key technical levels and market structure:
Trend and Price Activity
Downtrend Confirmation:
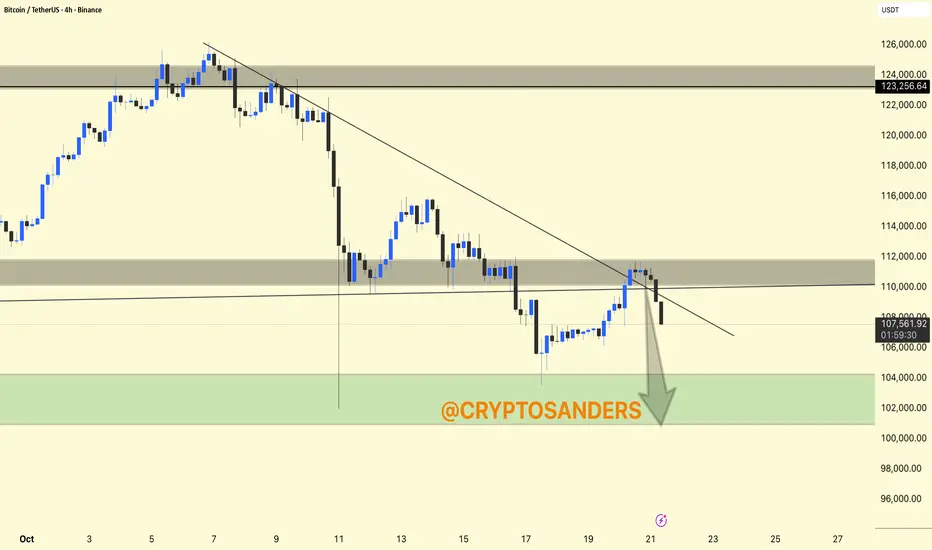
The price is clearly following a descending trendline. Attempts to break this line near the $111,000-$112,000 resistance level have failed.
Resistance Zone:
The gray area around $111,000-$112,000 represents a supply zone where the price struggled and faced selling pressure.
A very high resistance band exists near $123,000-$124,000 (upper chart), but the price is still well below this level.
Support Zone:
The large green box at $102,000-$106,000 marks a key demand zone, indicating where buyers could step in for a potential reversal or bounce.
DYOR | NFA
A view of Bitcoin, focusing on key technical levels and market structure:
Trend and Price Activity
Downtrend Confirmation:
The price is clearly following a descending trendline. Attempts to break this line near the $111,000-$112,000 resistance level have failed.
Resistance Zone:
The gray area around $111,000-$112,000 represents a supply zone where the price struggled and faced selling pressure.
A very high resistance band exists near $123,000-$124,000 (upper chart), but the price is still well below this level.
Support Zone:
The large green box at $102,000-$106,000 marks a key demand zone, indicating where buyers could step in for a potential reversal or bounce.
DYOR | NFA
Bài đăng liên quan
Thông báo miễn trừ trách nhiệm
Thông tin và các ấn phẩm này không nhằm mục đích, và không cấu thành, lời khuyên hoặc khuyến nghị về tài chính, đầu tư, giao dịch hay các loại khác do TradingView cung cấp hoặc xác nhận. Đọc thêm tại Điều khoản Sử dụng.
Bài đăng liên quan
Thông báo miễn trừ trách nhiệm
Thông tin và các ấn phẩm này không nhằm mục đích, và không cấu thành, lời khuyên hoặc khuyến nghị về tài chính, đầu tư, giao dịch hay các loại khác do TradingView cung cấp hoặc xác nhận. Đọc thêm tại Điều khoản Sử dụng.