Is Bitcoin about to break through by exploring the upper edge of triangle organization?

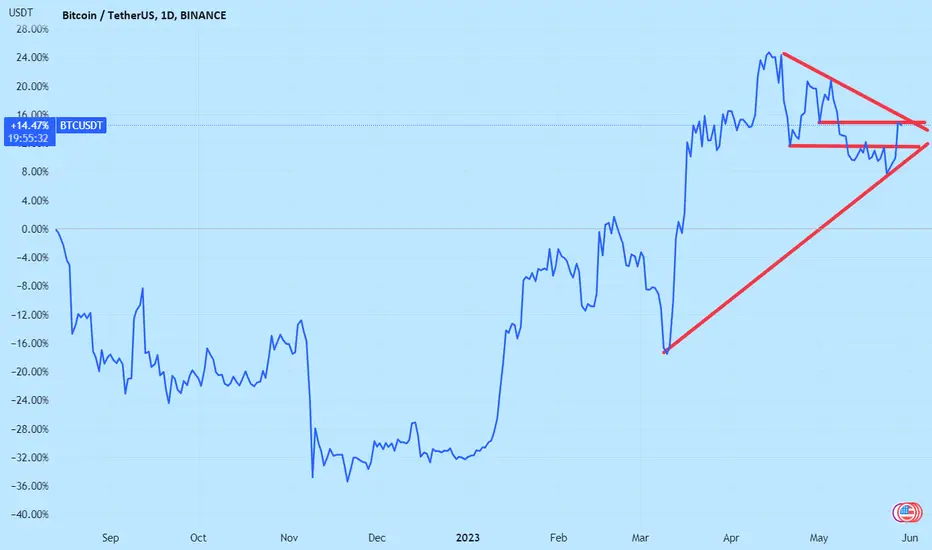
This figure shows the line chart of Bitcoin since September 2022. The graph overlays the lines between recent lows and lows, the lines between highs and highs, and the horizontal lines of recent bullish and bearish starting positions. As shown in the figure, Bitcoin has already faced strong pressure to break through the bearish starting point before the recent low point, opening up space! In the future, we need to focus on whether Bitcoin can break through the existing large triangle oscillation range in one go!
This figure shows the line chart of Bitcoin since September 2022. The graph overlays the lines between recent lows and lows, the lines between highs and highs, and the horizontal lines of recent bullish and bearish starting positions. As shown in the figure, Bitcoin has already faced strong pressure to break through the bearish starting point before the recent low point, opening up space! In the future, we need to focus on whether Bitcoin can break through the existing large triangle oscillation range in one go!
Thông báo miễn trừ trách nhiệm
Thông tin và ấn phẩm không có nghĩa là và không cấu thành, tài chính, đầu tư, kinh doanh, hoặc các loại lời khuyên hoặc khuyến nghị khác được cung cấp hoặc xác nhận bởi TradingView. Đọc thêm trong Điều khoản sử dụng.
Thông báo miễn trừ trách nhiệm
Thông tin và ấn phẩm không có nghĩa là và không cấu thành, tài chính, đầu tư, kinh doanh, hoặc các loại lời khuyên hoặc khuyến nghị khác được cung cấp hoặc xác nhận bởi TradingView. Đọc thêm trong Điều khoản sử dụng.