To start this post, I suggest you read the Bitcoin Roadmap that I shared with you yesterday.👇

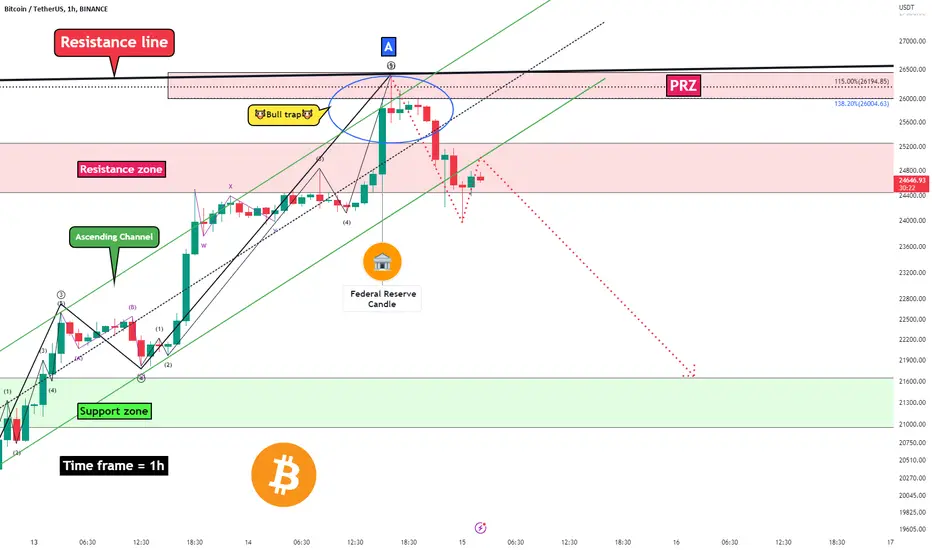
Bitcoin was moving in an ascending channel to complete main wave A, and breaking the 🔴resistance zone($25,250-$24,440)🔴 ahead was far from expectation.
Regarding to CPI announcement published by The Fed, we witnessed a 🐮Bull trap🐮 that ended above the ascending channel and near the resistance line and PRZ . Then the Bitcoin fell.
After the ascending channel breaks, we can almost confirm the end of main wave A.
Bitcoin is also likely to form a Head and Shoulders Pattern (Head = 🐮Bull trap🐮).
So, After a pull back to ascending channel, I expect Bitcoin to move towards the 🟢support zone($21,600-$20,940)🟢 over time or with a Sharpie mode.
Bitcoin Analyze ( BTCUSDT ), 1-hour time frame ⏰.
Do not forget to put Stop loss for your positions (For every position you want to open).
Please follow your strategy, this is just my Idea, and I will be glad to see your ideas in this post.
Please do not forget the ✅' like'✅ button 🙏😊 & Share it with your friends; thanks, and Trade safe.
Ghi chú
Shooting Star Candlestick Pattern can be sign for downward.
Ghi chú

Time frame =15min
🎁Get a 20% Discount on your trading FEE on BYBIT:👉partner.bybit.com/b/PEJMANZWIN
Bài đăng liên quan
Thông báo miễn trừ trách nhiệm
Thông tin và các ấn phẩm này không nhằm mục đích, và không cấu thành, lời khuyên hoặc khuyến nghị về tài chính, đầu tư, giao dịch hay các loại khác do TradingView cung cấp hoặc xác nhận. Đọc thêm tại Điều khoản Sử dụng.