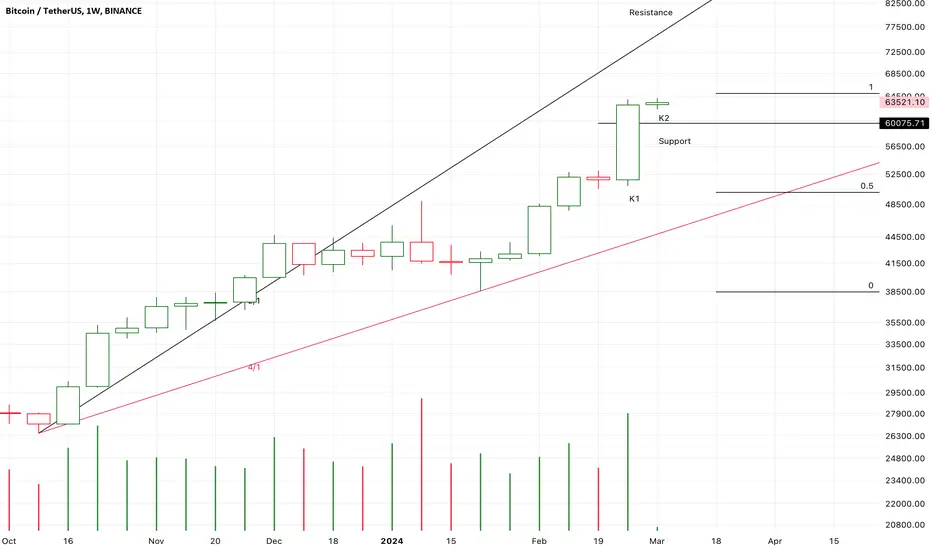
K1 just break up the nearest candles under average high volume.
It’s a strong signal that the market is still in the bullish stage.
It is most likely that K2 will keep accelerating and touch 75-80K area.
So, I will not leave the market until it touches 100K.
The potential support is 60K.
And the potential resistance is 2/1 Gann Line.
It is very safe to hold and wait for the candles to break up the historic highest price 70K area.
The supply pressure is normal here.
A sharp price correction will not come temporarily unless there is a sharply increased supply pressure in the following candles to stop the strong bullish momentum.
Ghi chú
K2 break up the historic highest price
but failed to close upon the price under relatively increased volume.
It attracts more buyers into the market.
It verified the market is still in the bullish stage.
The supply pressure had not sharply increased.
So, it is still safe to hold and buy in.
Ghi chú
K1 and K2 is strong bearish harami pattern.
It failed to close upon the historic highest price.
It means a larger scale price correction process had started from K1.
It is most likely a running flat correction.
It is still possible that K3 keeps breaking up and K4 fall back to resets the historic price.
It is still safe to hold for a longer time.
I will not sell or short it here.
Ghi chú
K3 and K4 verified a short-term downtrend.
It also verified a potential resistance and support.
It is likely that a larger scale horizontal trend had started from K2.
I think the price correction process will last for months.
Thông báo miễn trừ trách nhiệm
Thông tin và ấn phẩm không có nghĩa là và không cấu thành, tài chính, đầu tư, kinh doanh, hoặc các loại lời khuyên hoặc khuyến nghị khác được cung cấp hoặc xác nhận bởi TradingView. Đọc thêm trong Điều khoản sử dụng.
Thông báo miễn trừ trách nhiệm
Thông tin và ấn phẩm không có nghĩa là và không cấu thành, tài chính, đầu tư, kinh doanh, hoặc các loại lời khuyên hoặc khuyến nghị khác được cung cấp hoặc xác nhận bởi TradingView. Đọc thêm trong Điều khoản sử dụng.