https://www.tradingview.com/x/B0S4fLIx
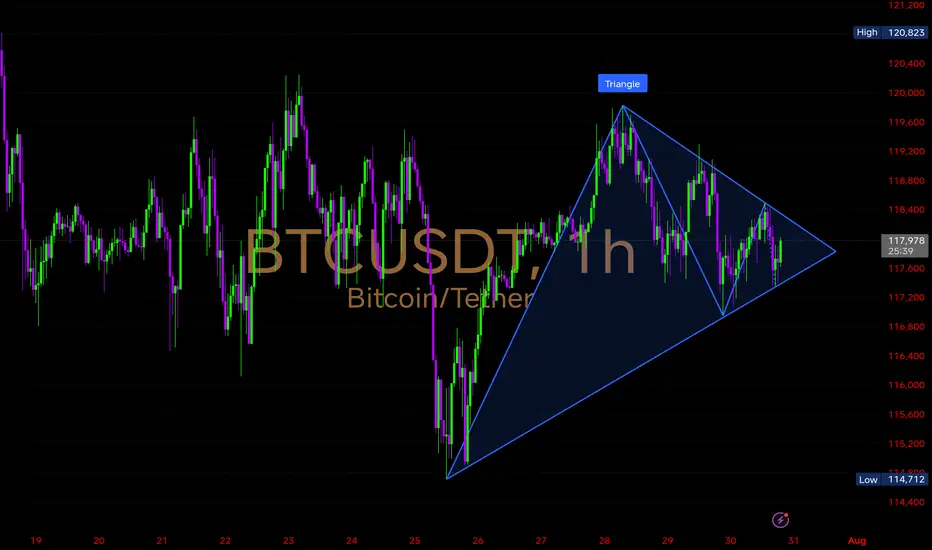
Bitcoin is compressing inside a well-defined symmetrical triangle on the 1-hour chart — a classic volatility squeeze setup🔺
• Triangle range: ~$120,800 (high) → $114,700 (low)
• Current price: ~$117,800
• Price nearing apex – breakout likely imminent within next few candles
• Lower highs + higher lows = indecision building
Probable Scenarios
🔹 Bullish Breakout
• Price must reclaim $118,500–$119,000 with strong volume
• Breakout above triangle top can lead to $120,800 retest
• Continuation supported by broader bullish structure
🔹 Bearish Breakdown
• Watch for clean rejection near $118,500 followed by a break below $117,000
• Losing the triangle bottom may open up $116,000 → $114,700 zone
Support: $117,000 / $116,000 / $114,700
Resistance: $118,500 / $120,000
🔁 Confirmation Needed:
• Watch for breakout + volume surge
• Sideways chop likely if price stays trapped
Thông báo miễn trừ trách nhiệm
Thông tin và các ấn phẩm này không nhằm mục đích, và không cấu thành, lời khuyên hoặc khuyến nghị về tài chính, đầu tư, giao dịch hay các loại khác do TradingView cung cấp hoặc xác nhận. Đọc thêm tại Điều khoản Sử dụng.
Thông báo miễn trừ trách nhiệm
Thông tin và các ấn phẩm này không nhằm mục đích, và không cấu thành, lời khuyên hoặc khuyến nghị về tài chính, đầu tư, giao dịch hay các loại khác do TradingView cung cấp hoặc xác nhận. Đọc thêm tại Điều khoản Sử dụng.