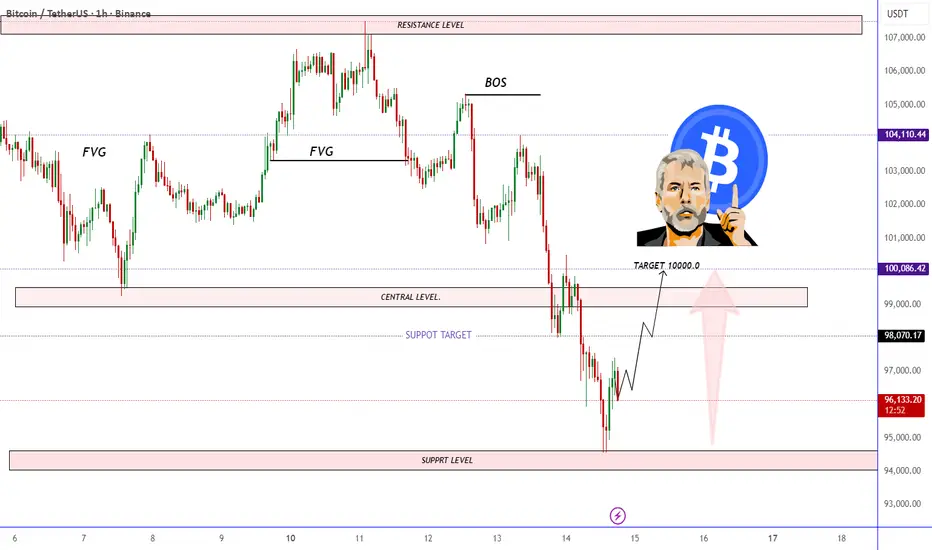
A Bitcoin price chart highlighting key ICT concepts including FVGs, BOS, support and resistance levels. The analysis suggests a potential bullish retracement from the support zone toward the central level, targeting the 100,000 USDT region. The layout shows expected price movement with marked liquidity zones and structural shifts.
Giao dịch đang hoạt động
Đóng lệnh: dừng lỗ
🎯XAUUSD GOLD BTCUSD Daily 4_5 Free Signals 🚀📊 join Telegram channel
t.me/Gold_blue_pipshunter
✨ Join My WhatsApp Premium Group! ✨ chat.whatsapp.com/EXNJ7pGViJbEKUCDbmTOwG
Join My WhatsApp Premium Group! ✨
t.me/Gold_blue_pipshunter
✨ Join My WhatsApp Premium Group! ✨ chat.whatsapp.com/EXNJ7pGViJbEKUCDbmTOwG
Join My WhatsApp Premium Group! ✨
Thông báo miễn trừ trách nhiệm
Thông tin và các ấn phẩm này không nhằm mục đích, và không cấu thành, lời khuyên hoặc khuyến nghị về tài chính, đầu tư, giao dịch hay các loại khác do TradingView cung cấp hoặc xác nhận. Đọc thêm tại Điều khoản Sử dụng.