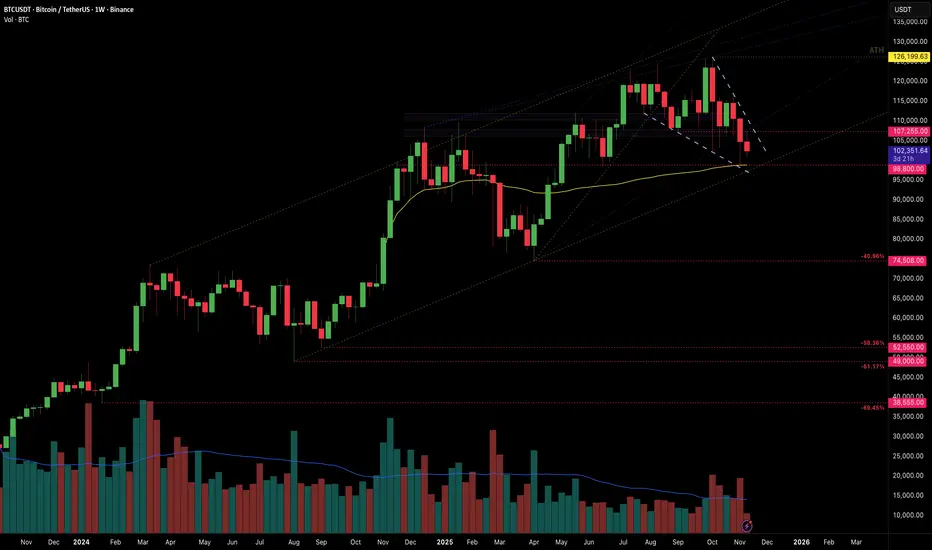
Since failure to break above 126K, I am looking for continuation of descent towards levels market in red. We have:
1. Three failed attempts to go above 120K.
2. Dominating selling volume on weekly BTC market capitalization chart.
3. Diamond / Bear Wedge Patterns formation on daily and weekly timeframes.
4. Approximate end of Bitcoin bull cycle.
5. Absence of supporting buy-back volume on any time frame.
6. Most of the pumps get dumped within an hour.
7. Clear huge sellers at 108K zone and 102K.
Ghi chú
- June, July, August, September = quiet months whose volume staying under the average line.- Look at October and November already. Crushing bearish volume.
- There were little buybacks. Look at green volume. It is not there. For months institutional buyers have already left the game leaving only retailers chasing the faked momentum.
- 401K won't save the overhyped crypto ETF macro this time. Why? Because only <1% goes into crypto overall.
Ghi chú
Update: Ghi chú
New 6 months low set. Now on to the targets. 90K will likely be next support.Ghi chú
I am not calling this a bear market. But there are enormous number of signs indicating that crypto only will enter it soon.
Master The Fall 🔻
Rise Above All #1
Rise Above All #1
Thông báo miễn trừ trách nhiệm
Thông tin và các ấn phẩm này không nhằm mục đích, và không cấu thành, lời khuyên hoặc khuyến nghị về tài chính, đầu tư, giao dịch hay các loại khác do TradingView cung cấp hoặc xác nhận. Đọc thêm tại Điều khoản Sử dụng.