This isn't just a correction; it's a journey down the rabbit hole. The recent "fake" ATH was a calculated move by the whales to engineer a deep pullback. This analysis maps out the key levels in this rabbit hole where Alice—and Bitcoin—might finally find the bottom and begin the climb to a new Wonderland.
After updating its ATH on August 14th, Bitcoin did not continue its global uptrend. It was merely a liquidity sweep of the previous ATH, which confirmed the formation of a large range on the weekly and daily structures. In essence, this new ATH was a deviation above the range, after which the asset began a sharp markdown, collecting all the internal liquidity.
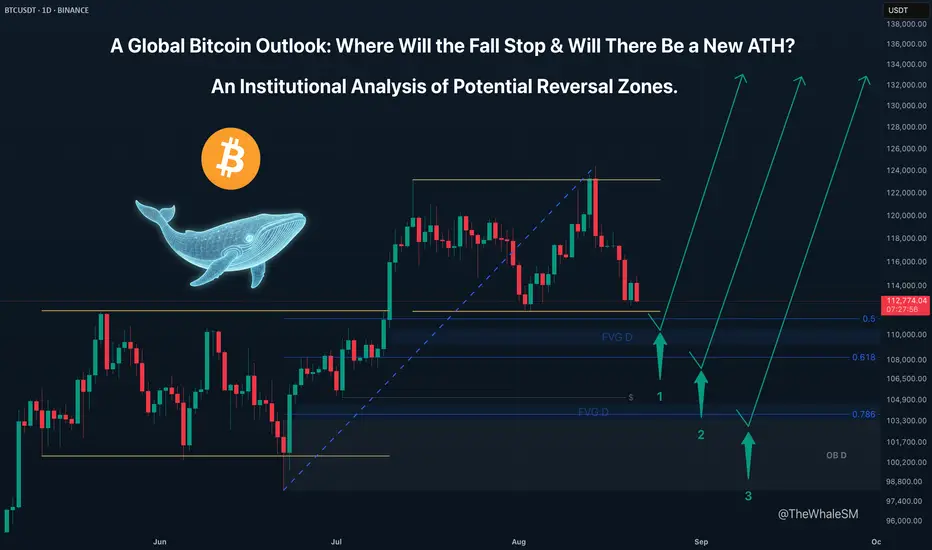
Most likely, the recent ATH was not the final one in this global bull cycle for Bitcoin because a proper, definitive high that would look like the start of a bear cycle was not established. Instead, it was achieved through a manipulation aimed at engineering a correction for the instrument down to key institutional levels.
Three Potential Long Scenarios
General Entry Conditions for All Scenarios:
Since these are levels from a global structure, a valid entry requires a clear reversal reaction and price finding acceptance above the respective Fib level. Confirmation of this may require waiting for 1-2 daily candles to close if the 1-4H candles do not immediately confirm the reversal.
If the final retracement level is broken, the price will most likely attack the June 22nd low at 98200. If the price finds acceptance below this level with daily/weekly candles, it would signal the end of the global bull cycle and the beginning of a bear market, but this is a distant and less probable perspective for now. I find it more probable that one of the three long scenarios will play out, and the price of Bitcoin will set a new, legitimate ATH.
Since the price is still inside the new large range—albeit near its lower boundary—reaching the first 50% global correction level may take some time and will likely happen next week. Whether this level can withstand the assault will determine if Bitcoin's fall continues, and just how deep Alice's rabbit hole truly is.
~~~~~~~~~~~~~~~~~~~~~~~~~~~~~~~~~~~~~~~~~~~~~~~~~~~~~~~~~~~~~~~~~
The principles and conditions for forming the manipulation zones I show in this trade idea are detailed in my educational publication, which was chosen by TradingView for the "Editor's Picks" category and received a huge amount of positive feedback from this insightful trading community. To better understand the logic I've used here and the general principles of price movement in most markets from the perspective of institutional capital, I highly recommend checking out this guide if you haven't already. 👇

P.S. This is not a prediction of the exact price direction. It is a description of high-probability setups that become valid only if specific conditions are met when the price reaches the marked POI. If the conditions are not met, the setups are invalid. No setup has a 100% success rate, so if you decide to use this trade idea, always apply a stop-loss and proper risk management. Trade smart.
~~~~~~~~~~~~~~~~~~~~~~~~~~~~~~~~~~~~~~~~~~~~~~~~~~~~~~~~~~~~~~~~~
If you found this analysis helpful, support it with a Boost! 🚀
Have a question or your own view on this idea? Share it in the comments. 💬
► Follow me on TradingView for timely updates on THIS idea (entry, targets & live trade management) and not to miss my next detailed breakdown.
~~~~~~~~~~~~~~~~~~~~~~~~~~~~~~~~~~~~~~~~~~~~~~~~~~~~~~~~~~~~~~~~~
After updating its ATH on August 14th, Bitcoin did not continue its global uptrend. It was merely a liquidity sweep of the previous ATH, which confirmed the formation of a large range on the weekly and daily structures. In essence, this new ATH was a deviation above the range, after which the asset began a sharp markdown, collecting all the internal liquidity.
Most likely, the recent ATH was not the final one in this global bull cycle for Bitcoin because a proper, definitive high that would look like the start of a bear cycle was not established. Instead, it was achieved through a manipulation aimed at engineering a correction for the instrument down to key institutional levels.
Three Potential Long Scenarios
General Entry Conditions for All Scenarios:
Since these are levels from a global structure, a valid entry requires a clear reversal reaction and price finding acceptance above the respective Fib level. Confirmation of this may require waiting for 1-2 daily candles to close if the 1-4H candles do not immediately confirm the reversal.
- SCENARIO 1 (Primary): The 50% Weekly Fib Level
This is the first corrective level from which a reversal is possible. A key confluence here is that reaching this level would be accompanied by a sweep of the external liquidity from the lower boundary of the range, as well as the mitigation of the upper boundary of the previous range, which could provide the necessary fuel for the next major impulse up. An added plus would be the price reaching the daily FVG that lies just below this level. - SCENARIO 2 (Deeper Correction): The 61.8% Weekly Fib Level
A break of the 50% level would mean that there wasn't enough liquidity and a deeper correction is needed. The next logical target would be the 61.8% level. - SCENARIO 3 (Final Defense): The 78.6% Weekly Fib Level
This is the last line of defense for the bullish structure. A reaction here would offer the most discounted entry to join the potential continuation of the bull run.
If the final retracement level is broken, the price will most likely attack the June 22nd low at 98200. If the price finds acceptance below this level with daily/weekly candles, it would signal the end of the global bull cycle and the beginning of a bear market, but this is a distant and less probable perspective for now. I find it more probable that one of the three long scenarios will play out, and the price of Bitcoin will set a new, legitimate ATH.
Since the price is still inside the new large range—albeit near its lower boundary—reaching the first 50% global correction level may take some time and will likely happen next week. Whether this level can withstand the assault will determine if Bitcoin's fall continues, and just how deep Alice's rabbit hole truly is.
~~~~~~~~~~~~~~~~~~~~~~~~~~~~~~~~~~~~~~~~~~~~~~~~~~~~~~~~~~~~~~~~~
The principles and conditions for forming the manipulation zones I show in this trade idea are detailed in my educational publication, which was chosen by TradingView for the "Editor's Picks" category and received a huge amount of positive feedback from this insightful trading community. To better understand the logic I've used here and the general principles of price movement in most markets from the perspective of institutional capital, I highly recommend checking out this guide if you haven't already. 👇
P.S. This is not a prediction of the exact price direction. It is a description of high-probability setups that become valid only if specific conditions are met when the price reaches the marked POI. If the conditions are not met, the setups are invalid. No setup has a 100% success rate, so if you decide to use this trade idea, always apply a stop-loss and proper risk management. Trade smart.
~~~~~~~~~~~~~~~~~~~~~~~~~~~~~~~~~~~~~~~~~~~~~~~~~~~~~~~~~~~~~~~~~
If you found this analysis helpful, support it with a Boost! 🚀
Have a question or your own view on this idea? Share it in the comments. 💬
► Follow me on TradingView for timely updates on THIS idea (entry, targets & live trade management) and not to miss my next detailed breakdown.
~~~~~~~~~~~~~~~~~~~~~~~~~~~~~~~~~~~~~~~~~~~~~~~~~~~~~~~~~~~~~~~~~
Ghi chú
UPDATE: BitcoinBitcoin's move towards the first 50% Fibonacci retracement level of the higher timeframe was halted last Friday by Powell's unexpected statement about a possible interest rate cut as early as September. This led to an intensive weakening of the Dollar Index by 0.7% and a sharp return of Bitcoin back inside the range.
Just before this news event, the price managed to sweep the external liquidity from the lower boundary of the range, forming a new 4H order block in the process. This order block will now serve as support and an obstacle for the price on its path to a deeper correction towards the expected levels.
I still anticipate the price to dip to one of these levels before it makes a new, legitimate ATH. However, before that, the price may first show a reversal reaction from this new 4H order block, after which it could rise to the midline of the range or even its upper boundary and spend some more time inside the range. This scenario of a potential rise from the lower boundary of the range can be considered an intermediate long setup. I have outlined the entry conditions for it in a separate trade idea:

Ghi chú
UPDATE: BitcoinThe intermediate long scenario, which I mentioned as a possibility in my last update, did not play out. A sharp downward move invalidated that short-term setup, confirming that the bounce on Friday was purely a reaction to unexpected news.
This development brings us back to the main thesis of this global analysis. The price has reaffirmed its intention to undergo a deeper correction. As expected, the first of our three potential reversal zones—the 50% weekly Fibonacci level—has now been reached. The real test begins now, as we must observe whether this level will hold or if the correction will continue its journey deeper into the "rabbit hole."
Ghi chú
UPDATE: BitcoinThe first day of the week showed that the 50% level was not broken on the first attempt and has held for now. The first daily candle to reach the level closed with its body above it. However, there has not yet been confirmation on the 1-4H timeframe. Furthermore, the price fell just short of reaching the daily FVG below, so there is still interest for the price in that area.
Therefore, I will be waiting for today's daily candle to close, which we will see tomorrow. If it also closes with its body above the 50% level, and especially above the lower boundary of the range, it will mean the price has found acceptance above the level and has returned inside the range. In that case, a long position could be considered once a bullish order flow begins.
If, however, the price continues its downward move and the level is broken, I will then watch for a reaction at the next 61.8% weekly Fibonacci retracement level.
Ghi chú
UPDATE: BitcoinToday showed that the 50% level has been broken with Bitcoin falling out of the range. Thus, the first long scenario with a minimal correction has been canceled, and the rabbit hole for Bitcoin will be deeper.
I am now expecting the price to reach the next 61.8% retracement level in accordance with the original plan and will be watching the reaction to it. If this level is not reached immediately, but after a pullback to the range above, then shorts could be considered with a target of the 61.8% or 78.6% levels. If that happens, I will publish a separate, intermediate short idea with entry conditions.
Ghi chú
UPDATE: BitcoinThe 61.8% level has held on the weekly timeframe, and the price has found acceptance above it with daily candles. Thus, an upward price move can be expected. It is unlikely that this will be a move to a new ATH because the price still has a POI below in the form of a daily order block and liquidity from the July 2nd low. However, at the very least, Bitcoin could rise to the old range and the daily FVG within it.
The 4H timeframe shows that a Break of Structure to the upside has occurred, during which a 4H order block was formed.
On the 1-hour timeframe, you can see that a bullish order flow is beginning to emerge. The price first had a clear reversal reaction from a 1-hour order block and is now approaching the 4H order block and a second 1-hour order block located within it.
As for entry conditions, I will be waiting for a mitigation of the 4H or 1H order block in conjunction with a reversal reaction from one of the local Fibonacci levels. If the 50% retracement level is reached, the price must also sweep the Asian session low.
Giao dịch đang hoạt động
The reversal occurred from the 61 local fib level and the second 1H order block.Đóng lệnh: đạt mục tiêu
UPDATE: BitcoinThe price has reached the minimum target in the form of the daily FVG, meaning the 61.8% level from the weekly structure has worked out well. Simultaneously with reaching this FVG, a liquidity sweep of the Previous Week's High (PWH) occurred, and the price reached the daily Break of Structure level (BOS D).
If this level holds on the daily timeframe (with daily candles closing with their bodies below it), we can expect a continuation of the corrective move down to the next 78.6% weekly Fibonacci level. If, however, this level is broken, the price will continue its upward movement towards the next resistance levels.
Ghi chú
UPDATE: BitcoinAnd so, the price has moved above the daily Break of Structure level, flipping it bullish again, and is continuing to play out the long setup from the second scenario.
For now, the price has paused at the resistance in the form of the 50% level, but this is a fairly weak resistance that will most likely be broken. A more serious resistance may be offered by the next 61.8% Fibonacci retracement level, because it will be accompanied by a liquidity sweep of the high at $117,430. If this level is broken, the final resistance will be the 78.6% level, and a break of that would signal a move to a new ATH.
🚀 Get my Institutional Trade Setups & Watchlist.
Stop guessing. Get the exact Levels, POIs & Trade Plans I am watching daily.
Exclusive for my community.
► Get Free Access:
thewhalesm.com
Stop guessing. Get the exact Levels, POIs & Trade Plans I am watching daily.
Exclusive for my community.
► Get Free Access:
thewhalesm.com
Bài đăng liên quan
Thông báo miễn trừ trách nhiệm
Thông tin và các ấn phẩm này không nhằm mục đích, và không cấu thành, lời khuyên hoặc khuyến nghị về tài chính, đầu tư, giao dịch hay các loại khác do TradingView cung cấp hoặc xác nhận. Đọc thêm tại Điều khoản Sử dụng.