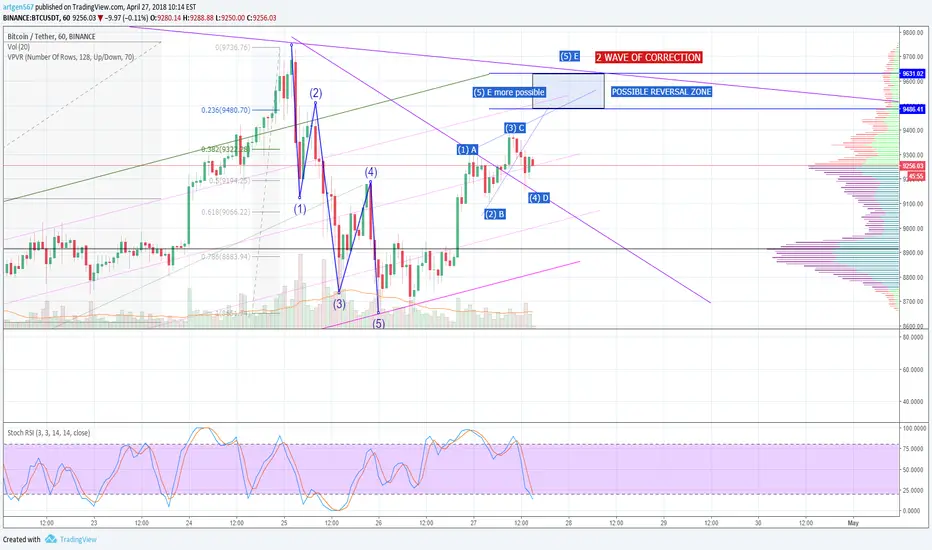
Publish possible structure of wave 1st this correction.
Now we are in 2nd correction Wave and waiting 5 local wave. More possible level for ending this is 9480 (also 0.236 fib level of this 1st wave).
Next stop in Wave 3 is 8150 or 7850 support.
Write comments guys, what are you thinking about this correction?
Sentiments very bullish but we not tested 7140-7560 zone. And this is can be very attractive levels to start new longs.
Ghi chú
Second scenario how it can be if we have triange here.Ghi chú
Any thoughts?Ghi chú
Ghi chú
Ready for breakout. Next resistance 10800-11700.Ghi chú
Nice breakout of triangle. It could be 1st wave of new cycle. Waiting for correction to 9400.Ghi chú
Still moving through resistance. Risks to start new lons now very high.Ghi chú
Bearish divergenceGhi chú
Falling wedge reversal pattern.Ghi chú
0.618 fib correction happen. Now we can get triangle or some like this.Ghi chú
Bearish divergenceGhi chú
BTC just got 0.5 fib correction of april run.I see pullback to around 8880 or we going to hell at 8280.
Ghi chú
Publish possible wave structure. This is positive view.Other is completely bearish scenario to around 5600 zone till the end of may.
Ghi chú
Update pullback targetGhi chú
Long term support and Stoch RSI falling wedge reversal soonGhi chú
Wave structure of correctionGhi chú
Wave 5 possible structureGhi chú
Big volume - possible breakout. Need to clear 8800 and 9200Ghi chú
Ghi chú
Flat dip. End of correction.Ghi chú
Fake breakout.Volume not support us. 8000 re-bounce failed. Well, we going under.7800
7500
7400-6800 major support
I like 7500 level, also because this is 0.236 level of fib.
Ghi chú
I have for you 3 options to understanding current situation:* Breakout of 8370 with volume mean starting new run
* Flat bottom in the game
* 7800 still possible
About deeper 7500-6500 -dont think so. Market shows signs of strength.
Ghi chú
VPVR reversal levels - 7340 and 7190Ghi chú
Some info about correction durationGhi chú
Here is my thoughts about "why this is not the end"1. Still low volume - big players waiting
2. We not finish figure (touch support at 6900)
3. It can be "false breakout" or just B wave to 7800-8100
4. According to Wyckoff accumulatoin scheme we need to see capitulation before big run up. Reasons? To remove weak hands from the market and get good price for large players.
5. Possible levels of correction end - 5200-5600
Ghi chú
VPVR + 4h MA99 targetGhi chú
Moving to 7300 bounce/reversal zone. Short-term still bearish. 6900 need to be tested. 6500 and 6000 also in the game.Thông báo miễn trừ trách nhiệm
Thông tin và ấn phẩm không có nghĩa là và không cấu thành, tài chính, đầu tư, kinh doanh, hoặc các loại lời khuyên hoặc khuyến nghị khác được cung cấp hoặc xác nhận bởi TradingView. Đọc thêm trong Điều khoản sử dụng.
Thông báo miễn trừ trách nhiệm
Thông tin và ấn phẩm không có nghĩa là và không cấu thành, tài chính, đầu tư, kinh doanh, hoặc các loại lời khuyên hoặc khuyến nghị khác được cung cấp hoặc xác nhận bởi TradingView. Đọc thêm trong Điều khoản sử dụng.