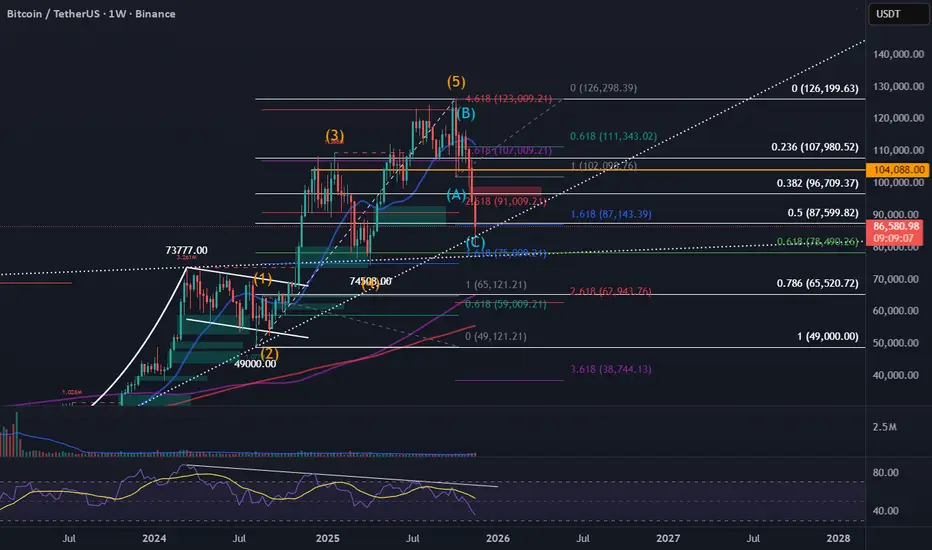
This chart provides a long-term Elliott Wave and Fibonacci confluence analysis for Bitcoin on the weekly timeframe.
After completing a full 5-wave impulsive structure, BTC appears to have entered a corrective ABC pattern, with Wave (C) extending sharply into major support levels. Current price action is testing a powerful cluster of Fibonacci retracements and extensions, including the 1.618, 0.618, and a long-term ascending trendline.
Expection: weekly candle closing above 87,143 and go upwards.
Thông báo miễn trừ trách nhiệm
Thông tin và các ấn phẩm này không nhằm mục đích, và không cấu thành, lời khuyên hoặc khuyến nghị về tài chính, đầu tư, giao dịch hay các loại khác do TradingView cung cấp hoặc xác nhận. Đọc thêm tại Điều khoản Sử dụng.
Thông báo miễn trừ trách nhiệm
Thông tin và các ấn phẩm này không nhằm mục đích, và không cấu thành, lời khuyên hoặc khuyến nghị về tài chính, đầu tư, giao dịch hay các loại khác do TradingView cung cấp hoặc xác nhận. Đọc thêm tại Điều khoản Sử dụng.