Hi!
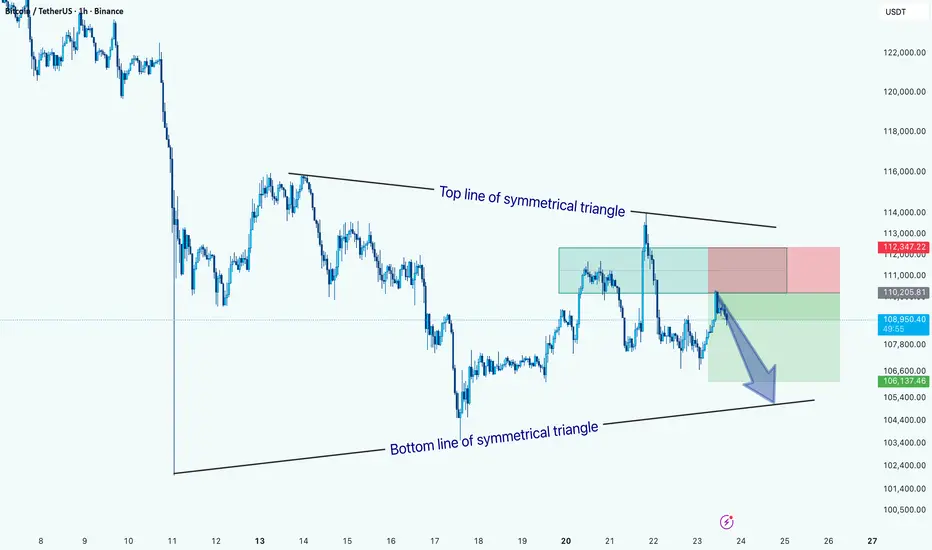
The price action is currently forming a symmetrical triangle pattern, marked by converging trendlines, the top line showing lower highs and the bottom line showing higher lows.
At present, BTC is trading near the upper half of the pattern but has recently faced rejection from the top trendline, indicating potential bearish pressure. The highlighted setup suggests a short position targeting a move toward the bottom boundary of the triangle around $106,000–$105,500, with a stop loss near $112,300.
A confirmed break below the lower trendline could accelerate bearish momentum, while a breakout above the top line would invalidate this bearish scenario and signal possible trend reversal.
Bias: Bearish within the symmetrical triangle until a clear breakout occurs.
Key Levels:
- Resistance: $112,300
- Support: $106,000 / $105,500
Giao dịch đang hoạt động
Đóng lệnh: dừng lỗ
Proud ThinkMarkets Ambassador -> Discover & Grow: bit.ly/Think-Markets
------
My recommended Exchange -> YEX: bit.ly/YEX-M
------
Telegram channel: t.me/melikatrader94
Forex channel: t.me/melikatrader94GoldForex
------
My recommended Exchange -> YEX: bit.ly/YEX-M
------
Telegram channel: t.me/melikatrader94
Forex channel: t.me/melikatrader94GoldForex
Bài đăng liên quan
Thông báo miễn trừ trách nhiệm
Thông tin và các ấn phẩm này không nhằm mục đích, và không cấu thành, lời khuyên hoặc khuyến nghị về tài chính, đầu tư, giao dịch hay các loại khác do TradingView cung cấp hoặc xác nhận. Đọc thêm tại Điều khoản Sử dụng.