# Price Trends: Bitcoin is trading above key exponential moving averages (EMAs) on daily charts (20-day: $108,285; 50-day: $105,843; 100-day: $101,952; 200-day: $95,985), signaling sustained bullish momentum.
# Support and Resistance:Support: $110,000–$111,909 is a critical support zone. A drop below could test $105,000 or $101,000.
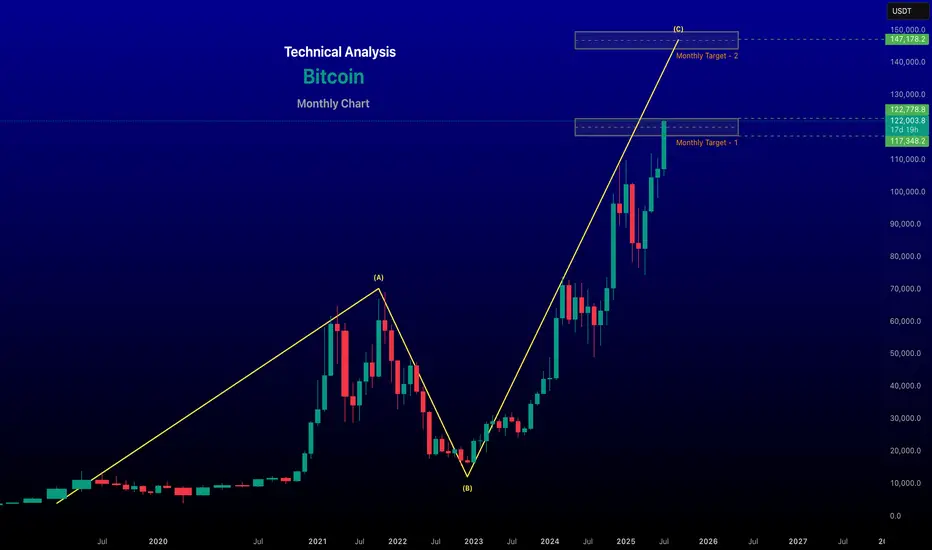
# Resistance: $125,724–$126,000 is the next hurdle. A breakout above could target $145,000–$150,000
Chart for your reference
~~ Disclaimer --
This analysis is based on recent technical data and market sentiment from web sources. It is for informational \ educational purposes only and not financial advice. Trading involves high risks, and past performance does not guarantee future results. Always conduct your own research or consult a SEBI-registered advisor before trading.
#Boost and comment will be highly appreciated
# Support and Resistance:Support: $110,000–$111,909 is a critical support zone. A drop below could test $105,000 or $101,000.
# Resistance: $125,724–$126,000 is the next hurdle. A breakout above could target $145,000–$150,000
Chart for your reference
~~ Disclaimer --
This analysis is based on recent technical data and market sentiment from web sources. It is for informational \ educational purposes only and not financial advice. Trading involves high risks, and past performance does not guarantee future results. Always conduct your own research or consult a SEBI-registered advisor before trading.
#Boost and comment will be highly appreciated
renderwithme
Thông báo miễn trừ trách nhiệm
Thông tin và các ấn phẩm này không nhằm mục đích, và không cấu thành, lời khuyên hoặc khuyến nghị về tài chính, đầu tư, giao dịch hay các loại khác do TradingView cung cấp hoặc xác nhận. Đọc thêm tại Điều khoản Sử dụng.
renderwithme
Thông báo miễn trừ trách nhiệm
Thông tin và các ấn phẩm này không nhằm mục đích, và không cấu thành, lời khuyên hoặc khuyến nghị về tài chính, đầu tư, giao dịch hay các loại khác do TradingView cung cấp hoặc xác nhận. Đọc thêm tại Điều khoản Sử dụng.