📉 BTCUSDT Elliott Wave Analysis – End of the Rally or Start of a Crash? ⚠️
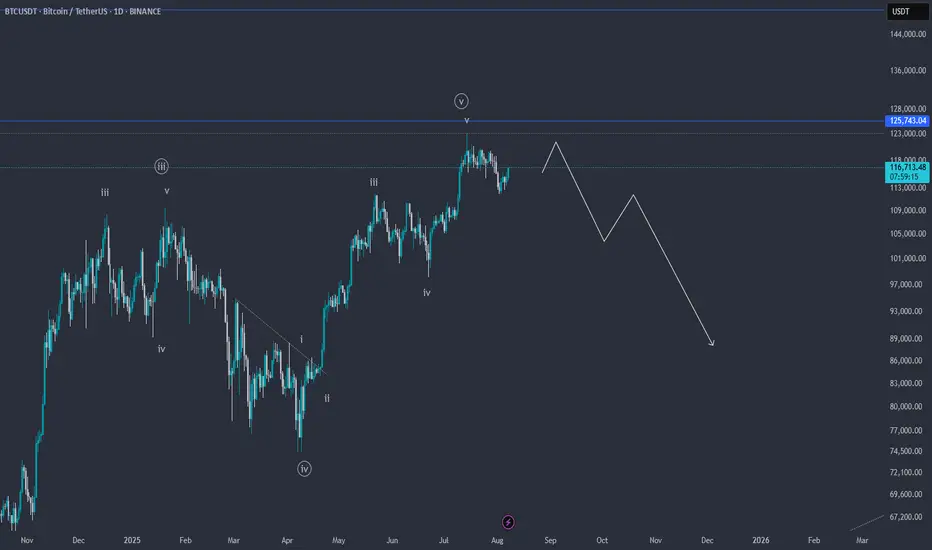
On the BTCUSDT chart, it appears that the fifth wave of the impulsive structure is nearing completion. The wave count clearly shows a full five-wave sequence, suggesting that Bitcoin may be forming a major top around the $119,000–$125,000 resistance zone.
🔻 If price action confirms a reversal and breaks key support levels, we could see a deep correction potentially taking BTC below $90,000.
📌 Keep in mind this is a scenario based on wave structure and requires confirmation via breakdowns and price action.
💬 What do you think? Is Bitcoin ready for a major correction, or will it break into new all-time highs?
✅ Save this idea & follow for updates!
Thông báo miễn trừ trách nhiệm
Thông tin và ấn phẩm không có nghĩa là và không cấu thành, tài chính, đầu tư, kinh doanh, hoặc các loại lời khuyên hoặc khuyến nghị khác được cung cấp hoặc xác nhận bởi TradingView. Đọc thêm trong Điều khoản sử dụng.
Thông báo miễn trừ trách nhiệm
Thông tin và ấn phẩm không có nghĩa là và không cấu thành, tài chính, đầu tư, kinh doanh, hoặc các loại lời khuyên hoặc khuyến nghị khác được cung cấp hoặc xác nhận bởi TradingView. Đọc thêm trong Điều khoản sử dụng.