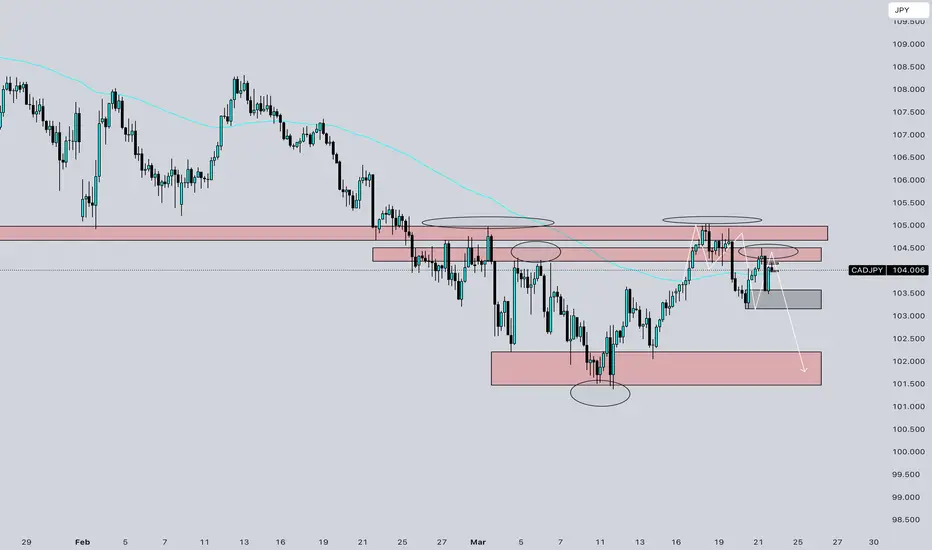
CADJPY - 4H Chart Sell Analysis
Market Structure
• The overall structure is bearish, with price forming lower highs and lower lows.
• Price attempted to rally but failed to break above 105.000, a major supply zone and previous support turned resistance.
• The most recent push above the highs appears to be a liquidity grab, followed by a strong rejection.
Supply & Resistance Zones
• Price reacted strongly to a key supply zone around 104.500 - 105.000.
• Multiple rejections and wicks in this zone suggest heavy selling interest.
• A fake breakout (bull trap) is visible, where buyers got trapped above resistance before a bearish move resumed.
Price Action Confirmation
• The bearish engulfing candle after the liquidity grab suggests a potential shift in momentum.
• Price broke below a minor support level and is currently retesting it, aligning with a lower high formation.
• The 50 EMA (blue line) is acting as dynamic resistance, further supporting the bearish bias.
Target Zones
• First target: 103.000 – a key intraday support and minor demand zone.
• Main target: 102.000 - 101.800 – a strong demand area and previous low where price may look to rebalance and tap liquidity.
Trade Setup
• Entry: Around 104.000 - 104.100 after a confirmed retest of broken support.
• Stop Loss: Above 104.500 - 104.700, outside the recent supply zone.
• Take Profit: Partial at 103.000, final TP at 102.000.
Confluences
1. Bearish trend continuation.
2. Liquidity grab above previous highs (105.000 area).
3. Rejection from major supply zone.
4. EMA resistance and structural confirmation of lower high.
Final Outlook
• If price stays below 104.300, sellers likely maintain control.
• A clean break below 103.500 will confirm further downside.
• A move and close above 105.000 would invalidate this sell setup.
Telegram Trading Channel - t.me/DBFXTraderChannel
Bài đăng liên quan
Thông báo miễn trừ trách nhiệm
Thông tin và ấn phẩm không có nghĩa là và không cấu thành, tài chính, đầu tư, kinh doanh, hoặc các loại lời khuyên hoặc khuyến nghị khác được cung cấp hoặc xác nhận bởi TradingView. Đọc thêm trong Điều khoản sử dụng.