Caplin Point (Weekly Timeframe) - Will the uptrend continue ?
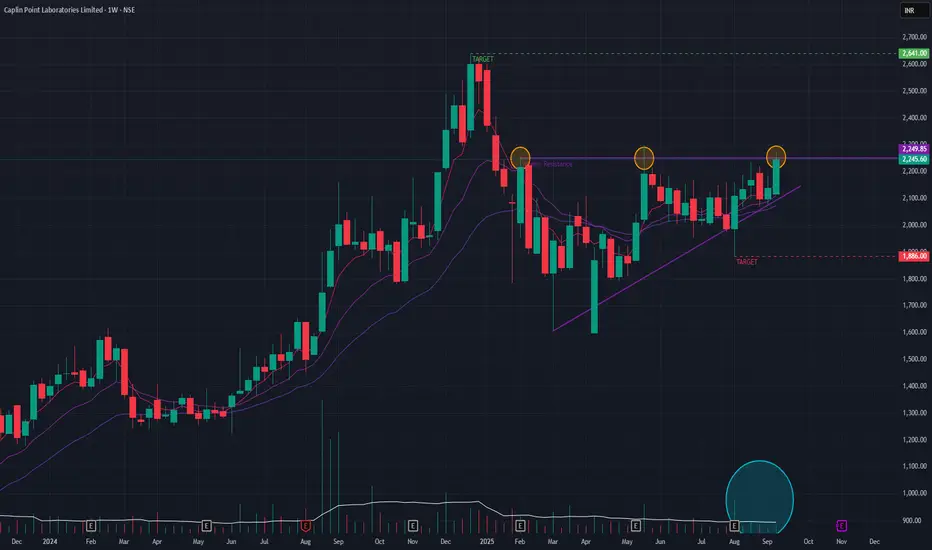
After a brief downtrend, Caplin Point has formed a classic triangle pattern, which often acts as a continuation signal for the preceding long-term uptrend. Technical indicators are favorable, with the short-term EMAs arranged in a bullish formation that signals strong underlying momentum.
The one element of caution is that recent trading volumes have been average. Therefore, a breakout from the triangle must be accompanied by a significant increase in volume to validate buyer conviction. If such a breakout occurs, the next logical objective would be the all-time high, which also serves as a key resistance zone at ₹2640. Conversely, if the pattern fails and momentum wanes, a pullback to the ₹1886 support level is possible.
Watchout for the price-action !!
Disclaimer: This analysis is my personal view & for educational purposes only. They shall not be construed as trade or investment advice. Before making any financial decision, it is imperative that you consult with a qualified financial professional.
Thông báo miễn trừ trách nhiệm
Thông tin và ấn phẩm không có nghĩa là và không cấu thành, tài chính, đầu tư, kinh doanh, hoặc các loại lời khuyên hoặc khuyến nghị khác được cung cấp hoặc xác nhận bởi TradingView. Đọc thêm trong Điều khoản sử dụng.