🔍 Key Levels
Based on recent technical data:
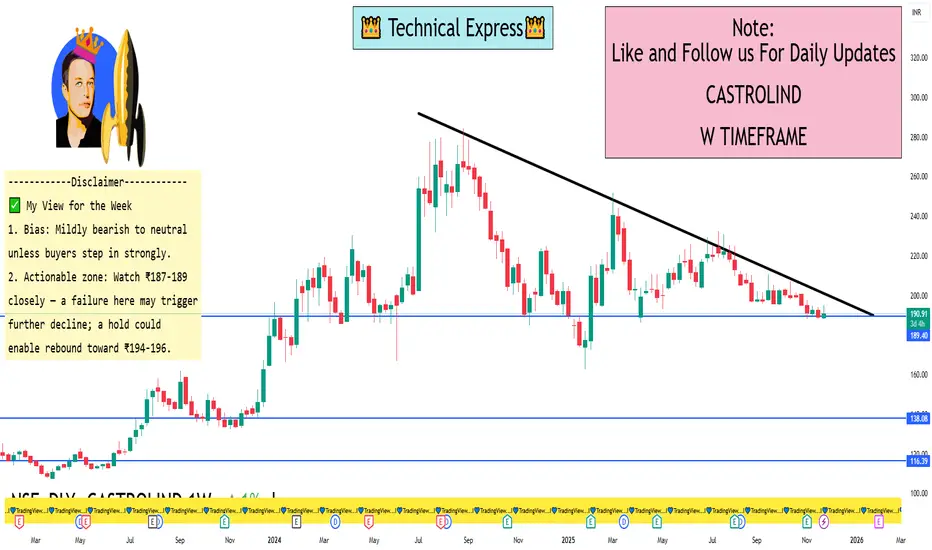
Support zone: ~ ₹187 – ₹189 (ET Money shows S3 ≈ ₹185.42, S2 ≈ ₹186.71)
Pivot / near-term equilibrium: ~ ₹190 – ₹191 (Weekly central pivot ~₹190.42)
Upside resistance: ~ ₹194 - ₹196 (Weekly R1 ~₹192.83, R2 ~₹196.64)
📈 Short-Term Bias & Likely Scenarios
The momentum indicators (RSI ~33, CCI negative) show the stock is under downward pressure/weak momentum.
If the price stays above ₹187-189, one could anticipate a bounce up into the ₹194-196 zone this week.
If it breaks below ~₹187-189 decisively, support further down could be ~₹183-185 (based on extension levels)
✅ My View for the Week
Bias: Mildly bearish to neutral unless buyers step in strongly.
Actionable zone: Watch ₹187-189 closely — a failure here may trigger further decline; a hold could enable rebound toward ₹194-196.
If you want a more aggressive trade setup (with stop-loss, reward ratio), I can map that too.
Based on recent technical data:
Support zone: ~ ₹187 – ₹189 (ET Money shows S3 ≈ ₹185.42, S2 ≈ ₹186.71)
Pivot / near-term equilibrium: ~ ₹190 – ₹191 (Weekly central pivot ~₹190.42)
Upside resistance: ~ ₹194 - ₹196 (Weekly R1 ~₹192.83, R2 ~₹196.64)
📈 Short-Term Bias & Likely Scenarios
The momentum indicators (RSI ~33, CCI negative) show the stock is under downward pressure/weak momentum.
If the price stays above ₹187-189, one could anticipate a bounce up into the ₹194-196 zone this week.
If it breaks below ~₹187-189 decisively, support further down could be ~₹183-185 (based on extension levels)
✅ My View for the Week
Bias: Mildly bearish to neutral unless buyers step in strongly.
Actionable zone: Watch ₹187-189 closely — a failure here may trigger further decline; a hold could enable rebound toward ₹194-196.
If you want a more aggressive trade setup (with stop-loss, reward ratio), I can map that too.
I built a Buy & Sell Signal Indicator with 85% accuracy.
📈 Get access via DM or
WhatsApp: wa.link/d997q0
Contact - +91 76782 40962
| Email: techncialexpress@gmail.com
| Script Coder | Trader | Investor | From India
📈 Get access via DM or
WhatsApp: wa.link/d997q0
Contact - +91 76782 40962
| Email: techncialexpress@gmail.com
| Script Coder | Trader | Investor | From India
Bài đăng liên quan
Thông báo miễn trừ trách nhiệm
Thông tin và các ấn phẩm này không nhằm mục đích, và không cấu thành, lời khuyên hoặc khuyến nghị về tài chính, đầu tư, giao dịch hay các loại khác do TradingView cung cấp hoặc xác nhận. Đọc thêm tại Điều khoản Sử dụng.