Triangle Pattern Strategy for Breakout within Range | Study Only
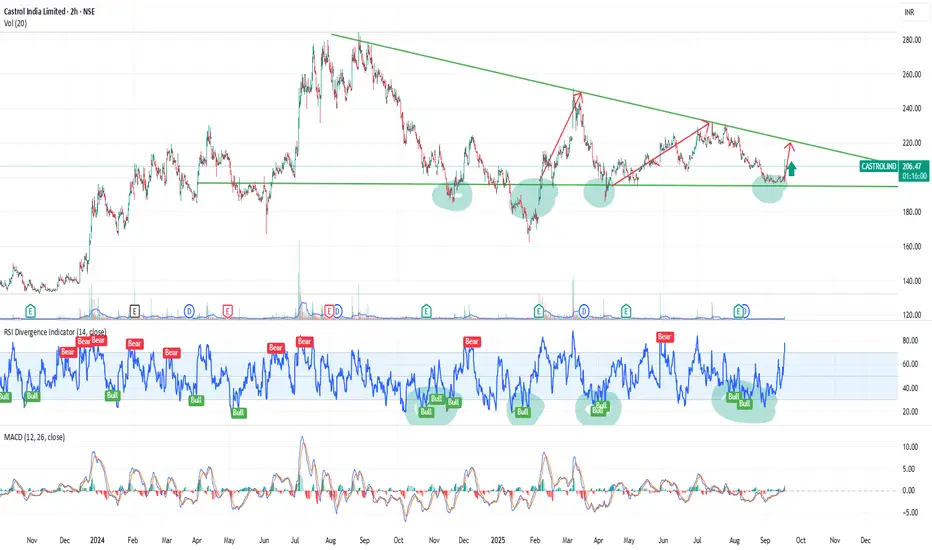
This chart showcases a symmetrical triangle pattern, where the price consolidates between two converging trendlines, indicating a period of market indecision. The formation of lower highs and higher lows suggests that the price is narrowing, setting up for a potential breakout.
Technically, the RSI is showing a bullish divergence as it rises from the oversold zone, while the MACD is crossing into positive territory, further supporting the possibility of an upward move. Volume indicators also highlight increasing interest, suggesting the potential for a breakout in the near term.
This is only view of my side by analysys of chart.
Note:
This analysis is purely for educational purposes and should not be considered as financial advice or a trading recommendation. Always conduct thorough research and consult a financial professional before making any trading decisions.
Giao dịch đang hoạt động
As this stock has at level bottom which is its support and also fundmental is strong this stock. which would take this up in long term.Bài đăng liên quan
Thông báo miễn trừ trách nhiệm
Thông tin và các ấn phẩm này không nhằm mục đích, và không cấu thành, lời khuyên hoặc khuyến nghị về tài chính, đầu tư, giao dịch hay các loại khác do TradingView cung cấp hoặc xác nhận. Đọc thêm tại Điều khoản Sử dụng.
Bài đăng liên quan
Thông báo miễn trừ trách nhiệm
Thông tin và các ấn phẩm này không nhằm mục đích, và không cấu thành, lời khuyên hoặc khuyến nghị về tài chính, đầu tư, giao dịch hay các loại khác do TradingView cung cấp hoặc xác nhận. Đọc thêm tại Điều khoản Sử dụng.