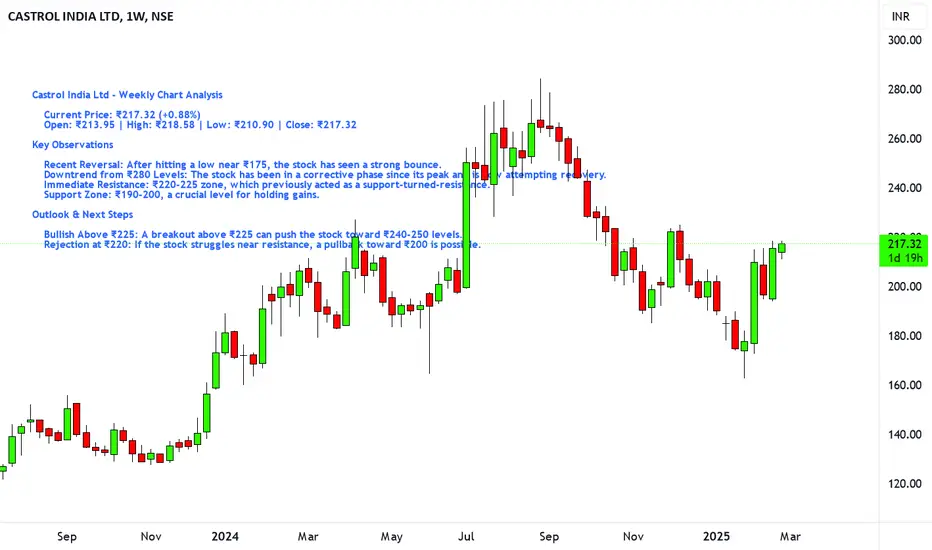
Castrol India Ltd - Weekly Chart Analysis
Current Price: ₹217.32 (+0.88%)
Open: ₹213.95 | High: ₹218.58 | Low: ₹210.90 | Close: ₹217.32
Key Observations
Recent Reversal: After hitting a low near ₹175, the stock has seen a strong bounce.
Downtrend from ₹280 Levels: The stock has been in a corrective phase since its peak and is now attempting recovery.
Immediate Resistance: ₹220-225 zone, which previously acted as a support-turned-resistance.
Support Zone: ₹190-200, a crucial level for holding gains.
Outlook & Next Steps
Bullish Above ₹225: A breakout above ₹225 can push the stock toward ₹240-250 levels.
Rejection at ₹220: If the stock struggles near resistance, a pullback toward ₹200 is possible.
Automated Tools/Indicators/Screeners available at kkonline.org/nimblrta
Thông báo miễn trừ trách nhiệm
Thông tin và ấn phẩm không có nghĩa là và không cấu thành, tài chính, đầu tư, kinh doanh, hoặc các loại lời khuyên hoặc khuyến nghị khác được cung cấp hoặc xác nhận bởi TradingView. Đọc thêm trong Điều khoản sử dụng.