Ceat announced its quarterly results on 29.4.2025 and the market gave big thumbsup to its numbers making the stock price surge up to 8% to Rs.3300 at the time of writing.
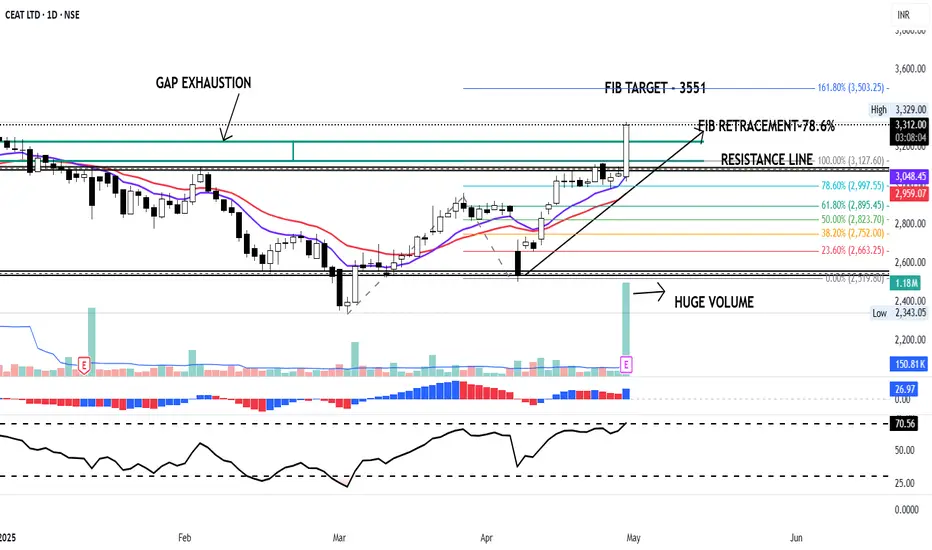
On the technical charts CEAT is looking very strong for the more upmove ahead. The stock has broken out of its Resitance zone of Rs.3050/3100 with strong volumes.
The stock has retraced 78.6% on 4th April which is considered a very good retracement according to the Fibonacci analysis. By using the Fibonacci extension tool the target for the stock comes to 3551 ( 161.8% target ).
The stock is trading above 11 and 22 days EMA, RSI is at 70 and MACD above zero line signifying bullish momentum. It has also exhausted the Gap created on the daily charts indicating the confidence in the stock.
Not a BUY/SELL RECOMNDATION
Giao dịch đang hoạt động
Ceat performing as expected!!! Đóng lệnh: đạt mục tiêu
Achieved Target sooner than expected!!! :-) Happy investing!!!Ghi chú
Crazy Moves in Ceat. This is the power of Fibonacci. Looks like an extended wave. Cheers :-)Ghi chú
Another 4% today. Wow!! Thông báo miễn trừ trách nhiệm
Thông tin và các ấn phẩm này không nhằm mục đích, và không cấu thành, lời khuyên hoặc khuyến nghị về tài chính, đầu tư, giao dịch hay các loại khác do TradingView cung cấp hoặc xác nhận. Đọc thêm tại Điều khoản Sử dụng.
Thông báo miễn trừ trách nhiệm
Thông tin và các ấn phẩm này không nhằm mục đích, và không cấu thành, lời khuyên hoặc khuyến nghị về tài chính, đầu tư, giao dịch hay các loại khác do TradingView cung cấp hoặc xác nhận. Đọc thêm tại Điều khoản Sử dụng.