We will examine the price dynamic on this chart. We already know the classic signals: bullish RSI, trading above EMA10/21/50, higher lows, consolidation, etc.
The classic signals are good and valid but this analysis adds another dimension.
The market moves in waves; up and down, up and down.
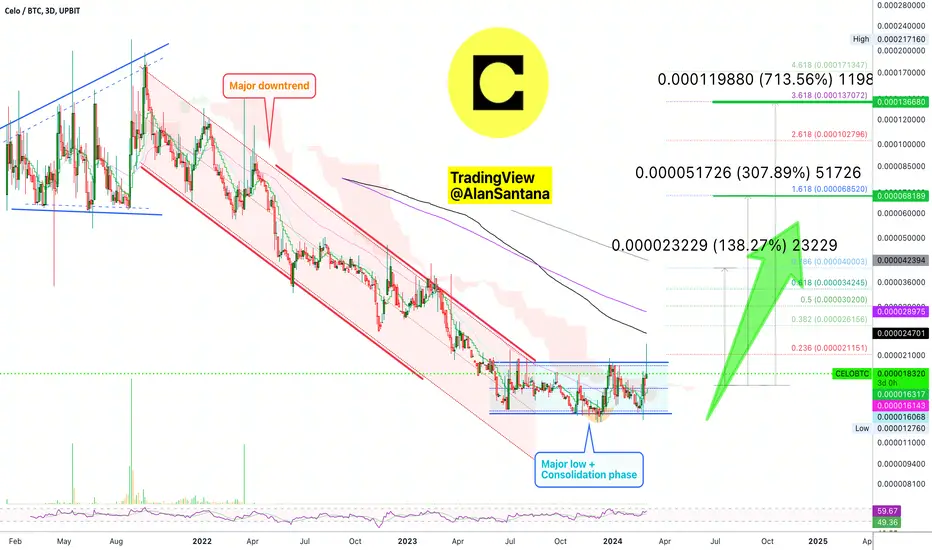
After a period of distribution in 2021, CELOBTC enters a bearish wave (down).
The bearish wave ends with price action going flat (consolidation).
After a bearish wave comes a bullish wave (up).
This "up" wave is what is depicted with a green arrow on the chart.
👉 Very easy, first target is set at 138%; this can happen right away.
👉 Still easy but can take longer, the second target is set at 308%.
👉 Finally, can be much higher just as it can be a bit lower; we can aim for 700% or more to end this bullish phase.
Namaste.
The classic signals are good and valid but this analysis adds another dimension.
The market moves in waves; up and down, up and down.
After a period of distribution in 2021, CELOBTC enters a bearish wave (down).
The bearish wave ends with price action going flat (consolidation).
After a bearish wave comes a bullish wave (up).
This "up" wave is what is depicted with a green arrow on the chart.
👉 Very easy, first target is set at 138%; this can happen right away.
👉 Still easy but can take longer, the second target is set at 308%.
👉 Finally, can be much higher just as it can be a bit lower; we can aim for 700% or more to end this bullish phase.
Namaste.
🚨 LIFETIME (Pay 1, Get 7)
lamatrades.com —Since 2017
🚨 Results
ETH +2150%
CRO +1272%
AAVE +1134%
DOGS +868%
SOL +861%
XRP +749%
BTC +580%
t.me/masteranandatrades/6681
😱 Wow & New Results
t.me/anandatrades/1350
lamatrades.com —Since 2017
🚨 Results
ETH +2150%
CRO +1272%
AAVE +1134%
DOGS +868%
SOL +861%
XRP +749%
BTC +580%
t.me/masteranandatrades/6681
😱 Wow & New Results
t.me/anandatrades/1350
Bài đăng liên quan
Thông báo miễn trừ trách nhiệm
Thông tin và ấn phẩm không có nghĩa là và không cấu thành, tài chính, đầu tư, kinh doanh, hoặc các loại lời khuyên hoặc khuyến nghị khác được cung cấp hoặc xác nhận bởi TradingView. Đọc thêm trong Điều khoản sử dụng.