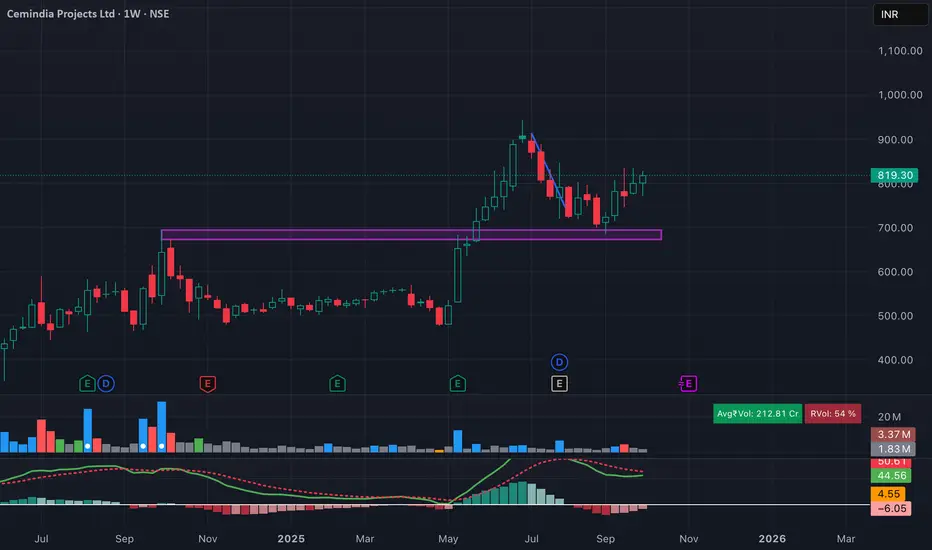
Cemindia Projects has successfully retested its breakout zone around 700–720 and is showing strength on the weekly chart. The stock has formed a higher low and is now turning up with fresh momentum. MACD is flattening out, suggesting trend reversal possibility.
📌 Swing Trade Idea
Entry Zone: Current levels (around 815–820)
Stop Loss (SL): 765 (Weekly closing basis)
View: As long as price holds above 765, bias remains bullish with potential for higher levels in the coming weeks.
📌 Swing Trade Idea
Entry Zone: Current levels (around 815–820)
Stop Loss (SL): 765 (Weekly closing basis)
View: As long as price holds above 765, bias remains bullish with potential for higher levels in the coming weeks.
Thông báo miễn trừ trách nhiệm
Thông tin và các ấn phẩm này không nhằm mục đích, và không cấu thành, lời khuyên hoặc khuyến nghị về tài chính, đầu tư, giao dịch hay các loại khác do TradingView cung cấp hoặc xác nhận. Đọc thêm tại Điều khoản Sử dụng.
Thông báo miễn trừ trách nhiệm
Thông tin và các ấn phẩm này không nhằm mục đích, và không cấu thành, lời khuyên hoặc khuyến nghị về tài chính, đầu tư, giao dịch hay các loại khác do TradingView cung cấp hoặc xác nhận. Đọc thêm tại Điều khoản Sử dụng.