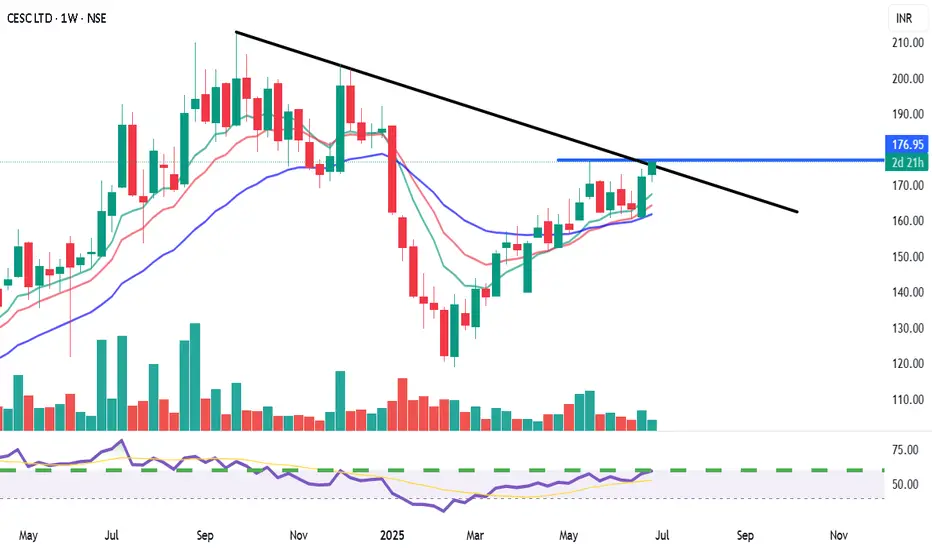
View: Bullish on confirmed breakout.
Bias: Positive momentum.
Strategy:
BUY: Above ₹178-180 (on weekly closing basis, confirming trendline and resistance breakout).
Targets (T):
T1: ₹195-200
T2: ₹210-220+
Stop-Loss (SL): ₹168 (on weekly closing basis).
Reasoning:
Attempting a breakout from a significant descending trendline.
Cleared horizontal resistance at ₹175.
Bullish crossover in moving averages with price above all MAs.
Strong RSI and supportive volume.
Potential for a major trend reversal.
Note: This is an educational analysis and not financial advice. Do your own due diligence before investing.
Thông báo miễn trừ trách nhiệm
Thông tin và các ấn phẩm này không nhằm mục đích, và không cấu thành, lời khuyên hoặc khuyến nghị về tài chính, đầu tư, giao dịch hay các loại khác do TradingView cung cấp hoặc xác nhận. Đọc thêm tại Điều khoản Sử dụng.
Thông báo miễn trừ trách nhiệm
Thông tin và các ấn phẩm này không nhằm mục đích, và không cấu thành, lời khuyên hoặc khuyến nghị về tài chính, đầu tư, giao dịch hay các loại khác do TradingView cung cấp hoặc xác nhận. Đọc thêm tại Điều khoản Sử dụng.