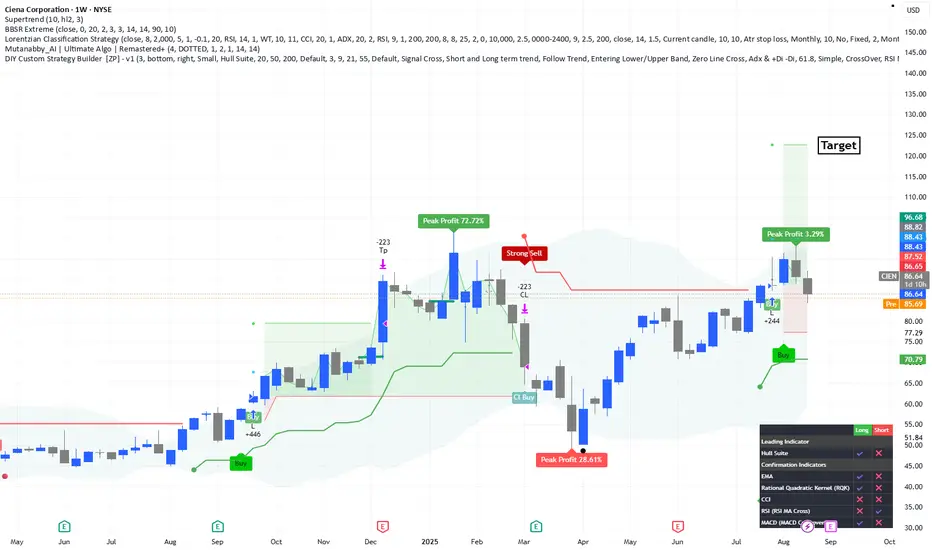
Spotted a promising long setup on Ciena Corporation (CIEN). The weekly chart shows bullish momentum supported by trend indicators and volume.
🔹 Entry Zone current levels
🔹 Stop Loss: $70 – below super trend
🔹 Target 1: $98.84 – first resistance zone
🔹 Target 2: $110.00 – extended target based on historical highs
Technical indicators like Supertrend, RSI, and MACD are aligning for a potential continuation. Risk management remains key – monitor volume and broader market sentiment.
Let me know your thoughts or if you're watching CIEN too!
#CIEN #Ciena #NYSE #TechnicalAnalysis #SwingTrade #TradingSetup #Finance
Thông báo miễn trừ trách nhiệm
Thông tin và ấn phẩm không có nghĩa là và không cấu thành, tài chính, đầu tư, kinh doanh, hoặc các loại lời khuyên hoặc khuyến nghị khác được cung cấp hoặc xác nhận bởi TradingView. Đọc thêm trong Điều khoản sử dụng.
Thông báo miễn trừ trách nhiệm
Thông tin và ấn phẩm không có nghĩa là và không cấu thành, tài chính, đầu tư, kinh doanh, hoặc các loại lời khuyên hoặc khuyến nghị khác được cung cấp hoặc xác nhận bởi TradingView. Đọc thêm trong Điều khoản sử dụng.