📈 Weekly Support & Resistance Levels
Support Levels:
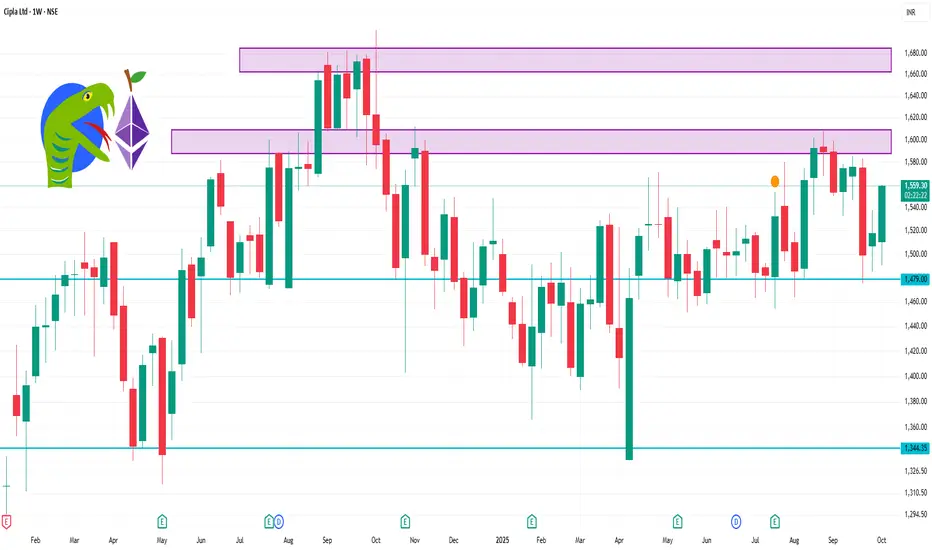
S1: ₹1,491.53
S2: ₹1,499.17
S3: ₹1,506.48
S4: ₹1,514.12
Resistance Levels:
R1: ₹1,521.43
R2: ₹1,529.07
R3: ₹1,536.38
R4: ₹1,544.70
These levels are derived from the classic pivot point method and can serve as potential entry or exit points for traders.
Technical Indicators Snapshot
Relative Strength Index (RSI): 77.43 (approaching overbought territory)
MACD: 7.01 (bullish crossover)
Average Directional Index (ADX): 30.49 (indicating a strong trend)
Commodity Channel Index (CCI): 307.2 (overbought)
Williams %R: -0.79 (overbought)
Rate of Change (ROC): 3.81% (bullish momentum)
Moving Averages:
5-day: ₹1,527.76
50-day: ₹1,510.91
200-day: ₹1,542.76
Support Levels:
S1: ₹1,491.53
S2: ₹1,499.17
S3: ₹1,506.48
S4: ₹1,514.12
Resistance Levels:
R1: ₹1,521.43
R2: ₹1,529.07
R3: ₹1,536.38
R4: ₹1,544.70
These levels are derived from the classic pivot point method and can serve as potential entry or exit points for traders.
Technical Indicators Snapshot
Relative Strength Index (RSI): 77.43 (approaching overbought territory)
MACD: 7.01 (bullish crossover)
Average Directional Index (ADX): 30.49 (indicating a strong trend)
Commodity Channel Index (CCI): 307.2 (overbought)
Williams %R: -0.79 (overbought)
Rate of Change (ROC): 3.81% (bullish momentum)
Moving Averages:
5-day: ₹1,527.76
50-day: ₹1,510.91
200-day: ₹1,542.76
Bài đăng liên quan
Thông báo miễn trừ trách nhiệm
Thông tin và các ấn phẩm này không nhằm mục đích, và không cấu thành, lời khuyên hoặc khuyến nghị về tài chính, đầu tư, giao dịch hay các loại khác do TradingView cung cấp hoặc xác nhận. Đọc thêm tại Điều khoản Sử dụng.
Bài đăng liên quan
Thông báo miễn trừ trách nhiệm
Thông tin và các ấn phẩm này không nhằm mục đích, và không cấu thành, lời khuyên hoặc khuyến nghị về tài chính, đầu tư, giao dịch hay các loại khác do TradingView cung cấp hoặc xác nhận. Đọc thêm tại Điều khoản Sử dụng.