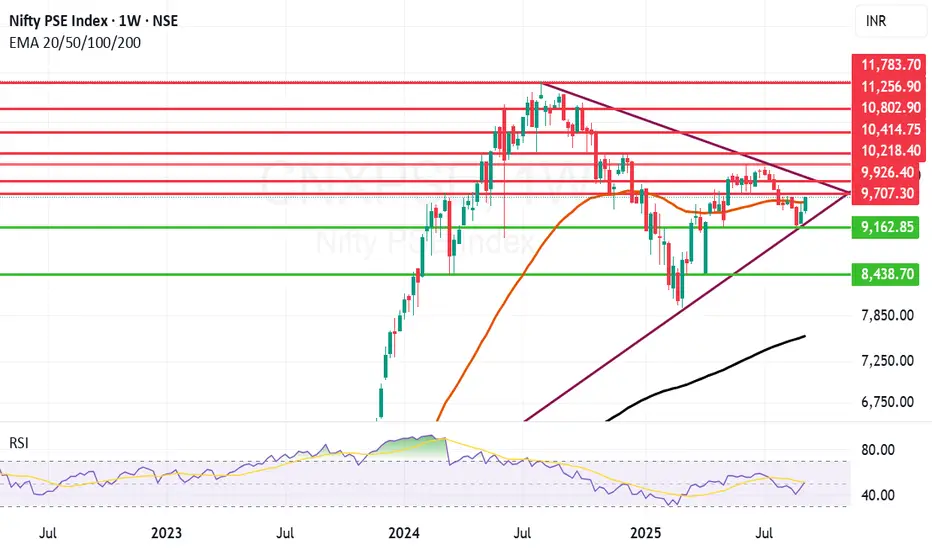
Nifty PSE Index on the Weekly chart has given a good closing above 50 Weeks EMA or a Mother line. RSI is also just below the median line and if we get a closing above 9708 then there are is a good possibility of it going towards 9926. Between 9926 and next resistance at 10218 there is a trend line resistance too. Once we get a closing above this zone the doors for 10414, 10802 and 11K+ level. Currently we got a weekly closing at 9658. Support for Nifty are at 9567 and 9162. If we get a closing below 9162 then PSE can fall towards 8438. Currently shadow of the candle is positive and the closing above Mother line makes it very possible for this index to grow further.
When the index is strong and gives a breakout it means that the undercurrent in majority of the companies which constitute the index is strong. There will be some companies which will obviously drag the index down as there cannot be one-way traffic. To know amongst these which companies to invest in an investor should look at fundamentals of the company, recent and past results, cash flows, Sales and order books, EPS and many other factors. While a Technical investor should look at charts of the companies before investing.
Nifty PSE index consists of 20 companies. The companies that constitute this index are BEL, BHEL, BPCL, Coal India, Container Corporation, GAIL, HAL, HPCL, IOC, IRCTC, IRFC, NHPC, NMDC, NTPC, ONGC, Oil India, PFC, Power Grid, REC and Rail Vikas Nigam Ltd. Amongst these companies look for strong performers within this index who have given a good result this quarter and have strong EPS growth and good order books as well as trailing PE ratio less than 10 years Average PE ratio. This would result in you finding out the companies which are undervalued and have good growth potential. Capital Goods are essential for a country to grow. A strong GDP will mostly mean strong performance by some these companies.
A smart investor would be a person who looks at both fundamentals and technicals of the company and invests in a fundamentally strong company which is giving a technical breakout. For this one has to learn Techno-Funda analysis. I have written a book on the subject called The Happy Candles Way To Wealth Creation. In this book you will learn the basics of Techno-Funda investing. The book is available on Amazon and is one of the highest rated books in its category. With an approval rating of 4.8/5 as on date. Lot of investors call it as a Hand book for Techno Funda investing. Most of the chapters are standalone and can be read at your own accord. It will be really helpful to you. To know more about Mother line, Father line and my Mother, Father and Small child theory, Parallel Channel you should once again I recommend, read my book the Happy Candles Way to Wealth Creation.
Disclaimer: The above information is provided for educational purpose, analysis and paper trading only. Please don't treat this as a buy or sell recommendation for the stock or index. The Techno-Funda analysis is based on data that is more than 3 months old. Supports and Resistances are determined by historic past peaks and Valley in the chart. Many other indicators and patterns like EMA, RSI, MACD, Volumes, Fibonacci, parallel channel etc. use historic data which is 3 months or older cyclical points. There is no guarantee they will work in future as markets are highly volatile and swings in prices are also due to macro and micro factors based on actions taken by the company as well as region and global events. Equity investment is subject to risks. I or my clients or family members might have positions in the stocks that we mention in our educational posts. We will not be responsible for any Profit or loss that may occur due to any financial decision taken based on any data provided in this message. Do consult your investment advisor before taking any financial decisions. Stop losses should be an important part of any investment in equity.
Thông báo miễn trừ trách nhiệm
Thông tin và ấn phẩm không có nghĩa là và không cấu thành, tài chính, đầu tư, kinh doanh, hoặc các loại lời khuyên hoặc khuyến nghị khác được cung cấp hoặc xác nhận bởi TradingView. Đọc thêm trong Điều khoản sử dụng.
Thông báo miễn trừ trách nhiệm
Thông tin và ấn phẩm không có nghĩa là và không cấu thành, tài chính, đầu tư, kinh doanh, hoặc các loại lời khuyên hoặc khuyến nghị khác được cung cấp hoặc xác nhận bởi TradingView. Đọc thêm trong Điều khoản sử dụng.