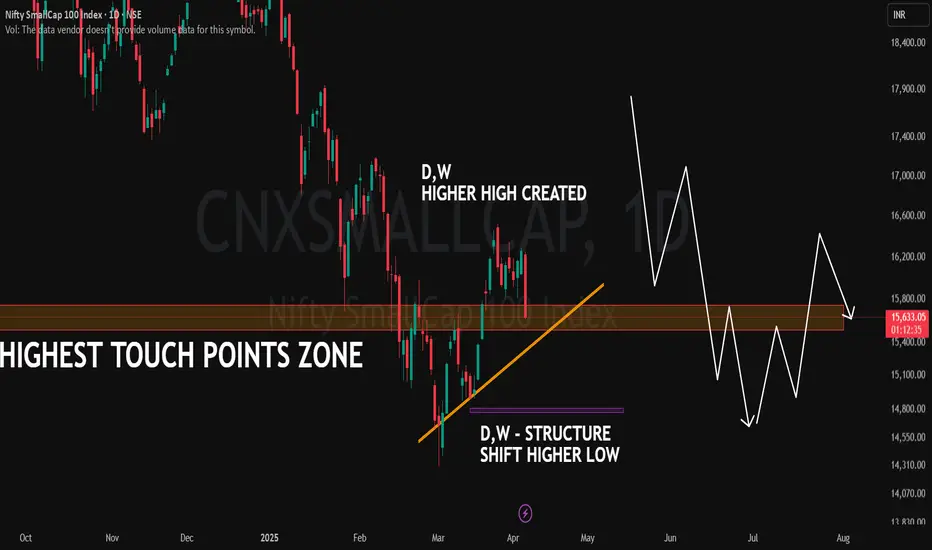
📊 Index: Nifty SmallCap 100 (NSE)
📉 CMP: 15,633 (-3.22%)
Chart Breakdown:
🔶 Highest Touch Points Zone: A key historical level where price has reacted multiple times.
📈 Higher High Created (D,W): Price has formed a higher high on both daily and weekly timeframes, indicating a shift in structure.
🟠 Trendline Support (Orange Line): A rising trendline acting as dynamic support.
🟣 Higher Low Structure (D,W): A significant shift where a higher low was established on daily and weekly charts.
The price is currently interacting with a crucial zone, making it a significant area to observe.
🎯 Master My Self-Made Trading Strategy
📈 Telegram (Learn Today): t.me/hashtaghammer
✅ WhatsApp (Learn Today): wa.me/919455664601
📈 Telegram (Learn Today): t.me/hashtaghammer
✅ WhatsApp (Learn Today): wa.me/919455664601
Bài đăng liên quan
Thông báo miễn trừ trách nhiệm
Thông tin và các ấn phẩm này không nhằm mục đích, và không cấu thành, lời khuyên hoặc khuyến nghị về tài chính, đầu tư, giao dịch hay các loại khác do TradingView cung cấp hoặc xác nhận. Đọc thêm tại Điều khoản Sử dụng.