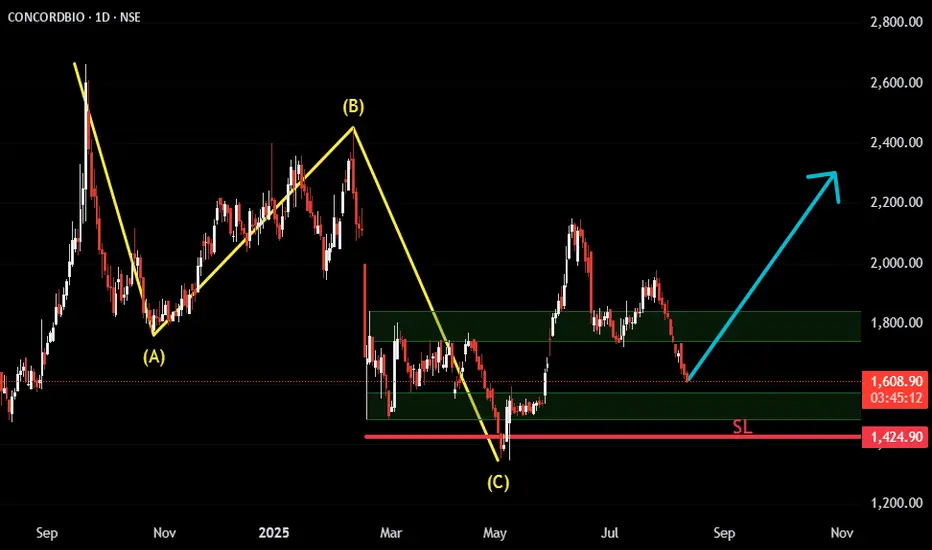
The chart shows an A-B-C corrective structure, where:
🔹 Wave A and Wave B are each divided into three smaller sub-waves (typical corrective behavior).
🔹 Wave C is impulsive, aligning with Elliott Wave guidelines for a clean correction completion.
📊 Fibonacci confluence supports this view — though I’ve not plotted Fib levels here to avoid making the chart look messy. You can check Fib retracement and extension levels on your own for confirmation.
Following the completion of this correction, the stock rallied strongly, breaking previous structure highs (BOS). We are now observing a pullback that itself is unfolding in an A-B-C form, potentially offering a good long entry in line with the prevailing bullish trend.
Chart Annotations:
🟩 Green Zones → Key support zones I’m watching for potential buying interest.
🔴 Red Line → Suggested Stop-Loss placement.
The idea here is to align with the trend, buy near support, and manage risk with a clear SL level
Thông báo miễn trừ trách nhiệm
Thông tin và ấn phẩm không có nghĩa là và không cấu thành, tài chính, đầu tư, kinh doanh, hoặc các loại lời khuyên hoặc khuyến nghị khác được cung cấp hoặc xác nhận bởi TradingView. Đọc thêm trong Điều khoản sử dụng.
Thông báo miễn trừ trách nhiệm
Thông tin và ấn phẩm không có nghĩa là và không cấu thành, tài chính, đầu tư, kinh doanh, hoặc các loại lời khuyên hoặc khuyến nghị khác được cung cấp hoặc xác nhận bởi TradingView. Đọc thêm trong Điều khoản sử dụng.