Bullish Strategy on Salesforce (CRM)
Looking at the daily chart of CRM, several technical signals support a medium-term bullish outlook:
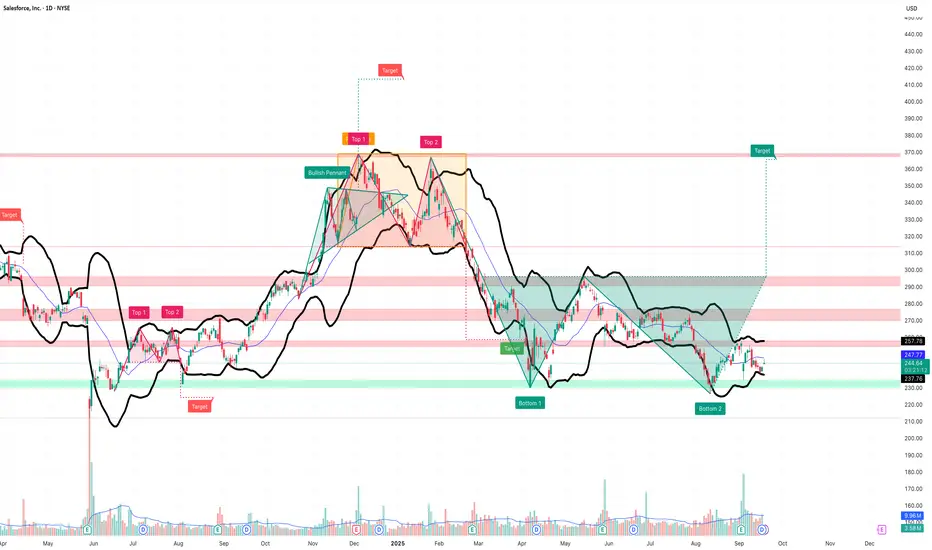
Double Bottom Pattern
A clear double bottom (Bottom 1 and Bottom 2) has formed between April and September.
This classic reversal pattern often signals the end of a downtrend and the start of a new bullish phase.
Falling Channel Breakout
After months of correction, price broke out of the descending channel, showing technical strength.
Projected Target
The double bottom projection suggests a potential upside toward 370 USD.
First key resistance lies at the 265–270 USD area, also aligned with a strong volume zone.
Supporting Indicators
Bollinger Bands: price is moving near the lower band, often a sign of a possible rebound.
Volumes: spikes observed around the bottoms, typical of accumulation phases.
🎯 Trading Plan
Entry zone: 240–247 USD (current consolidation).
First target: 270 USD.
Second target: 370 USD (pattern projection).
Stop-loss: below 227–230 USD (a breakdown would invalidate the setup).
👉 In summary: the technical setup shows accumulation signals and a potential reversal, offering a favorable risk/reward ratio for a bullish strategy.
Thông báo miễn trừ trách nhiệm
Thông tin và ấn phẩm không có nghĩa là và không cấu thành, tài chính, đầu tư, kinh doanh, hoặc các loại lời khuyên hoặc khuyến nghị khác được cung cấp hoặc xác nhận bởi TradingView. Đọc thêm trong Điều khoản sử dụng.
Thông báo miễn trừ trách nhiệm
Thông tin và ấn phẩm không có nghĩa là và không cấu thành, tài chính, đầu tư, kinh doanh, hoặc các loại lời khuyên hoặc khuyến nghị khác được cung cấp hoặc xác nhận bởi TradingView. Đọc thêm trong Điều khoản sử dụng.