📉 Key Support Levels (1H Timeframe)
₹5,436.67 – Immediate support level.
₹5,357.00 – Next support zone.
📈 Key Resistance Levels (1H Timeframe)
₹5,629.00 – Immediate resistance level.
₹5,708.67 – Next resistance zone.
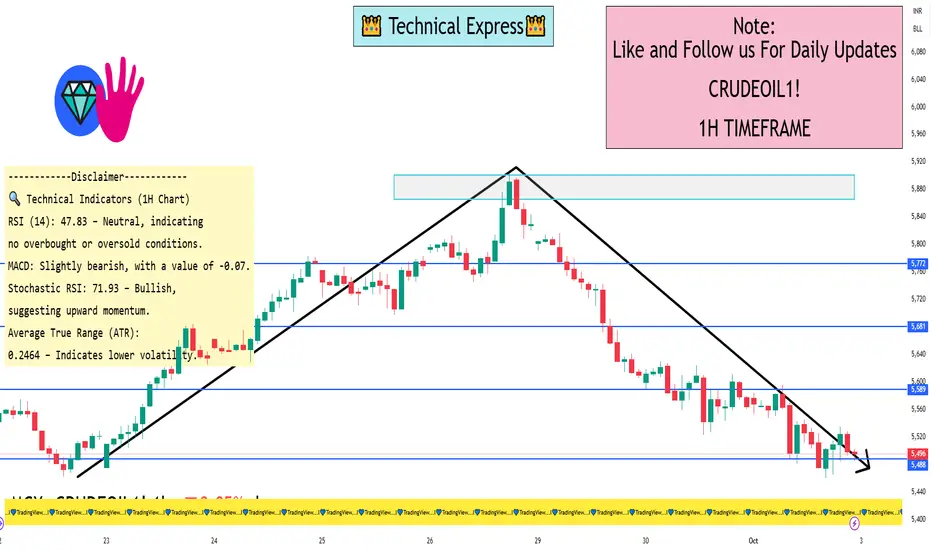
🔍 Technical Indicators (1H Chart)
RSI (14): 47.83 – Neutral, indicating no overbought or oversold conditions.
MACD: Slightly bearish, with a value of -0.07.
Stochastic RSI: 71.93 – Bullish, suggesting upward momentum.
Average True Range (ATR): 0.2464 – Indicates lower volatility.
Overall, the 1-hour chart shows a neutral to slightly bullish trend, with price action confined between ₹5,436.67 and ₹5,629.00. A breakout above ₹5,629.00 could target ₹5,708.67, while a drop below ₹5,436.67 may lead to retesting lower support levels.
₹5,436.67 – Immediate support level.
₹5,357.00 – Next support zone.
📈 Key Resistance Levels (1H Timeframe)
₹5,629.00 – Immediate resistance level.
₹5,708.67 – Next resistance zone.
🔍 Technical Indicators (1H Chart)
RSI (14): 47.83 – Neutral, indicating no overbought or oversold conditions.
MACD: Slightly bearish, with a value of -0.07.
Stochastic RSI: 71.93 – Bullish, suggesting upward momentum.
Average True Range (ATR): 0.2464 – Indicates lower volatility.
Overall, the 1-hour chart shows a neutral to slightly bullish trend, with price action confined between ₹5,436.67 and ₹5,629.00. A breakout above ₹5,629.00 could target ₹5,708.67, while a drop below ₹5,436.67 may lead to retesting lower support levels.
I built a Buy & Sell Signal Indicator with 85% accuracy.
📈 Get access via DM or
WhatsApp: wa.link/d997q0
Contact - +91 76782 40962
| Email: techncialexpress@gmail.com
| Script Coder | Trader | Investor | From India
📈 Get access via DM or
WhatsApp: wa.link/d997q0
Contact - +91 76782 40962
| Email: techncialexpress@gmail.com
| Script Coder | Trader | Investor | From India
Bài đăng liên quan
Thông báo miễn trừ trách nhiệm
Thông tin và các ấn phẩm này không nhằm mục đích, và không cấu thành, lời khuyên hoặc khuyến nghị về tài chính, đầu tư, giao dịch hay các loại khác do TradingView cung cấp hoặc xác nhận. Đọc thêm tại Điều khoản Sử dụng.