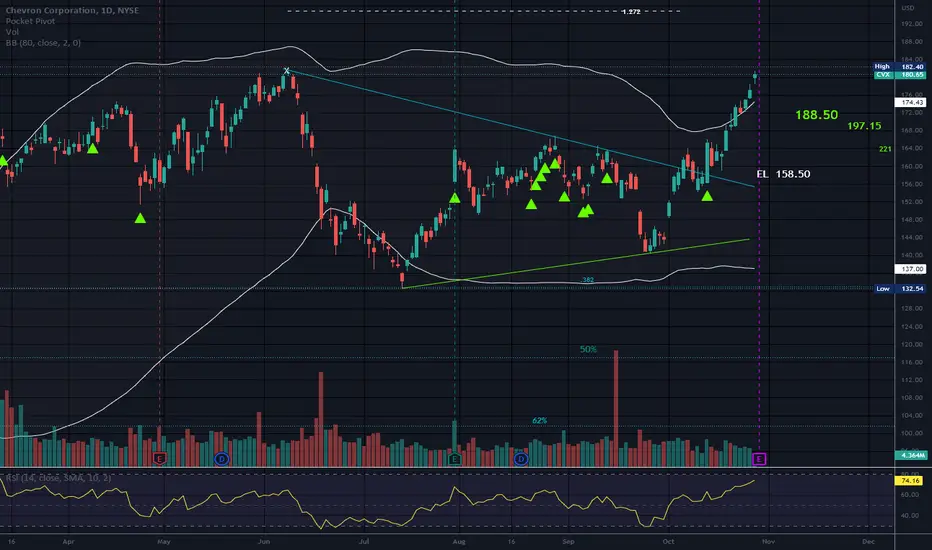
Price has broken up from a triangle.
Price is above the bands.
74ish on RSI. Some use 70 as an Overbought signal on RSI. When a security is super bullish, some use 80.
Earnings tomorrow BMO
No recommendation.
Possible pull back soon if profit taking kicks in.
Security is borderline overbought going in to earnings.
Candle of indecision so far today.
Ghi chú
A rounding top is a chart pattern used in technical analysis identified by price movements that, when graphed, form the shape of an upside-down "U." Rounding tops are found at the end of extended upward trends and may signify a reversal in long-term price movements.W pattern noted that has made it to the 1.113.
Thông báo miễn trừ trách nhiệm
Thông tin và ấn phẩm không có nghĩa là và không cấu thành, tài chính, đầu tư, kinh doanh, hoặc các loại lời khuyên hoặc khuyến nghị khác được cung cấp hoặc xác nhận bởi TradingView. Đọc thêm trong Điều khoản sử dụng.
Thông báo miễn trừ trách nhiệm
Thông tin và ấn phẩm không có nghĩa là và không cấu thành, tài chính, đầu tư, kinh doanh, hoặc các loại lời khuyên hoặc khuyến nghị khác được cung cấp hoặc xác nhận bởi TradingView. Đọc thêm trong Điều khoản sử dụng.