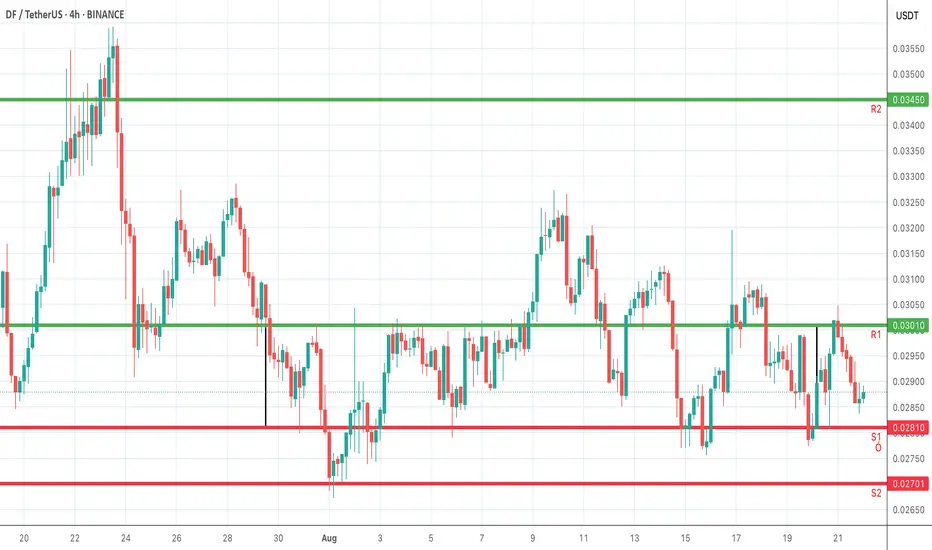
On the 4-hour chart, key support and resistance zones have been plotted. S1 and S2 represent the downside levels where demand could emerge, offering potential rebound points. R1 and R2 indicate resistance barriers on the upside, where selling pressure or profit-taking may appear. Monitoring price action around these levels is crucial: a breakout above resistance suggests bullish continuation, while a breakdown below support could signal further downside. Traders can align entries, exits, and stop-losses with these zones while confirming moves through trend and momentum indicators.
Thông báo miễn trừ trách nhiệm
Thông tin và ấn phẩm không có nghĩa là và không cấu thành, tài chính, đầu tư, kinh doanh, hoặc các loại lời khuyên hoặc khuyến nghị khác được cung cấp hoặc xác nhận bởi TradingView. Đọc thêm trong Điều khoản sử dụng.
Thông báo miễn trừ trách nhiệm
Thông tin và ấn phẩm không có nghĩa là và không cấu thành, tài chính, đầu tư, kinh doanh, hoặc các loại lời khuyên hoặc khuyến nghị khác được cung cấp hoặc xác nhận bởi TradingView. Đọc thêm trong Điều khoản sử dụng.