Thanks for the clarification! Yes — the chart **does** resemble an **Inverted Head and Shoulders** pattern (a bullish reversal pattern), especially visible in the price structure before the breakout above ₹6,278.
---
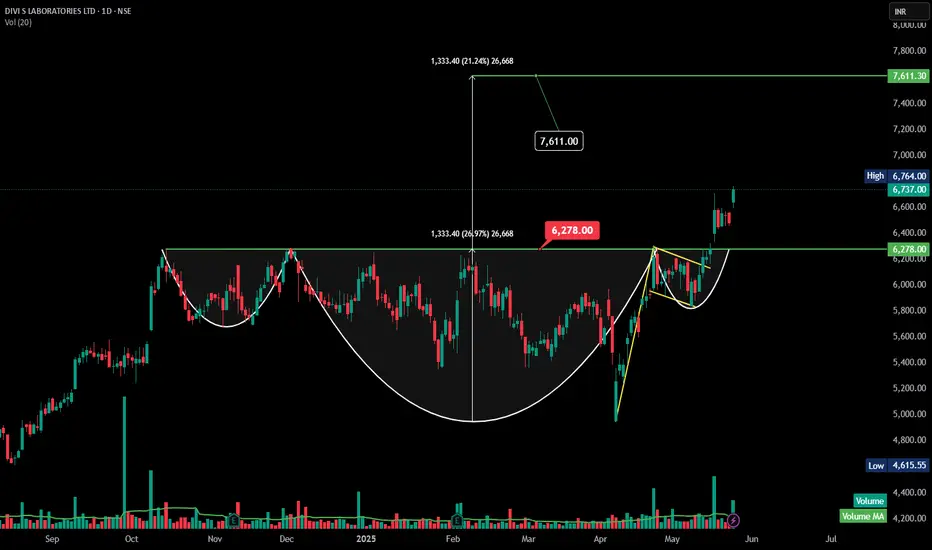
### 🟢 **Inverted Head and Shoulders – Analysis (Divi's Lab)**
#### **Pattern Structure:**
* **Left Shoulder:** Formed in March.
* **Head:** Deepest low around early April.
* **Right Shoulder:** Higher low formed in late April to early May.
* **Neckline:** Breakout above the ₹6,278 level confirms the pattern.
#### **Breakout Confirmation:**
* Breakout is strong, supported by **increasing volume**.
* Target derived from neckline to head height = approx. ₹1,333.
* **Target after breakout:** ₹6,278 + ₹1,333 = **₹7,611** (already marked on the chart).
---
---
### 🟢 **Inverted Head and Shoulders – Analysis (Divi's Lab)**
#### **Pattern Structure:**
* **Left Shoulder:** Formed in March.
* **Head:** Deepest low around early April.
* **Right Shoulder:** Higher low formed in late April to early May.
* **Neckline:** Breakout above the ₹6,278 level confirms the pattern.
#### **Breakout Confirmation:**
* Breakout is strong, supported by **increasing volume**.
* Target derived from neckline to head height = approx. ₹1,333.
* **Target after breakout:** ₹6,278 + ₹1,333 = **₹7,611** (already marked on the chart).
---
Thông báo miễn trừ trách nhiệm
Thông tin và các ấn phẩm này không nhằm mục đích, và không cấu thành, lời khuyên hoặc khuyến nghị về tài chính, đầu tư, giao dịch hay các loại khác do TradingView cung cấp hoặc xác nhận. Đọc thêm tại Điều khoản Sử dụng.
Thông báo miễn trừ trách nhiệm
Thông tin và các ấn phẩm này không nhằm mục đích, và không cấu thành, lời khuyên hoặc khuyến nghị về tài chính, đầu tư, giao dịch hay các loại khác do TradingView cung cấp hoặc xác nhận. Đọc thêm tại Điều khoản Sử dụng.