Disclaimer:
This analysis is for educational purposes only and does not constitute investment advice. Please do your own research (DYOR) before making any trading decisions.
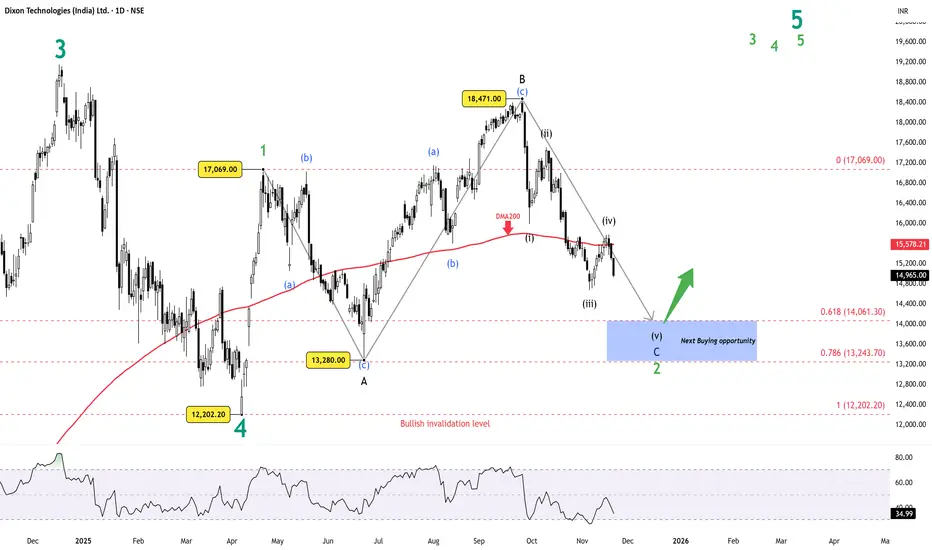
Dixon’s decline is developing as a running flat within Wave 2. Wave A and B are already in place, with Wave B stretching above the Wave A origin, which is typical behaviour when the larger trend is still strong. The final leg, Wave C, is still unfolding.
Inside Wave C, waves (i) through (iv) look complete, and the market appears to be working on wave (v). Momentum has been weakening throughout the drop, which often leads to an ending diagonal in the final wave of a running flat. The structure so far supports that possibility.
The 0.618 retracement near 14,061 is the critical zone for this setup. This level aligns with typical Wave 2 depth and sits right where wave (v) of C can complete. RSI has not yet shown bullish divergence, so a marginal lower low in price, paired with a higher low in RSI, would be the ideal confirmation signal.
If price forms the expected small ending diagonal into the 0.618 level and momentum improves, this would complete the running flat and set the stage for the next bullish sequence.
Summary
This analysis is for educational purposes only and does not constitute investment advice. Please do your own research (DYOR) before making any trading decisions.
Dixon’s decline is developing as a running flat within Wave 2. Wave A and B are already in place, with Wave B stretching above the Wave A origin, which is typical behaviour when the larger trend is still strong. The final leg, Wave C, is still unfolding.
Inside Wave C, waves (i) through (iv) look complete, and the market appears to be working on wave (v). Momentum has been weakening throughout the drop, which often leads to an ending diagonal in the final wave of a running flat. The structure so far supports that possibility.
The 0.618 retracement near 14,061 is the critical zone for this setup. This level aligns with typical Wave 2 depth and sits right where wave (v) of C can complete. RSI has not yet shown bullish divergence, so a marginal lower low in price, paired with a higher low in RSI, would be the ideal confirmation signal.
If price forms the expected small ending diagonal into the 0.618 level and momentum improves, this would complete the running flat and set the stage for the next bullish sequence.
Summary
- Wave 2 forming as a running flat.
- Wave C still in progress; wave (v) pending.
- Weak momentum favours an ending diagonal finish.
- Key reversal zone: 0.618 retracement near 14,061.
- Watching for bullish RSI divergence before confirmation.
WaveXplorer | Elliott Wave insights
📊 X profile: @veerappa89
📊 X profile: @veerappa89
Bài đăng liên quan
Thông báo miễn trừ trách nhiệm
Thông tin và các ấn phẩm này không nhằm mục đích, và không cấu thành, lời khuyên hoặc khuyến nghị về tài chính, đầu tư, giao dịch hay các loại khác do TradingView cung cấp hoặc xác nhận. Đọc thêm tại Điều khoản Sử dụng.