### 📊 **Chart Analysis: Potential W or Flag Breakout**
#### **1. Pattern Structure**
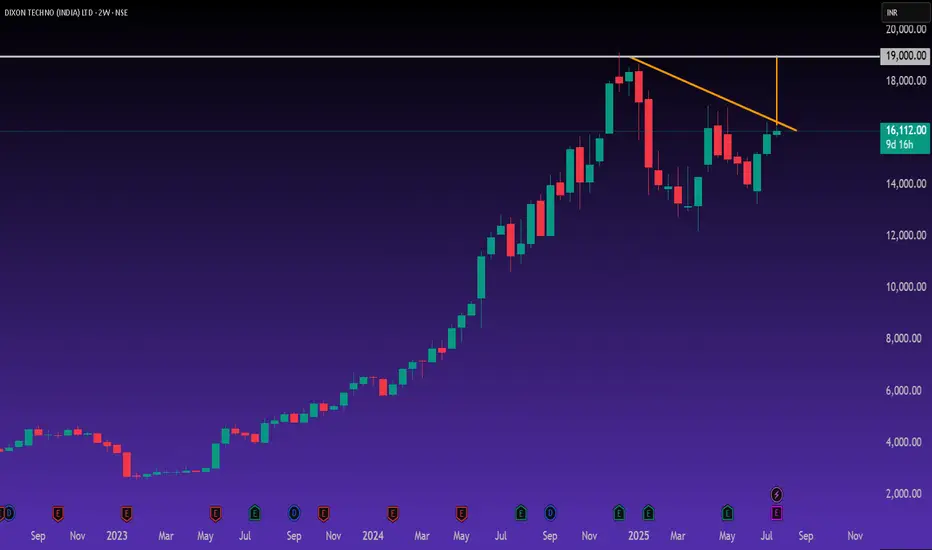
* The chart seems to be forming a **W-shaped base (Double Bottom)** or a **falling wedge / flag breakout**.
* The stock had made two significant lows, and now it's **attempting a breakout above the neckline/resistance** around the ₹16,000–₹16,200 zone.
* The **orange trendline** marks the falling resistance, which has now been **challenged**.
#### **2. Bullish Momentum**
* A **bullish engulfing candle** recently formed, indicating buyer strength.
* If the breakout sustains above the falling trendline and ₹16,500 zone, a **measured move towards ₹19,000+** looks very likely.
#### **3. Target Projection**
* Based on the **height of the pattern**, the vertical distance from the bottom to the neckline gives a **potential breakout target of ₹19,000**, which is also marked on the chart.
#### **4. Confirmation Levels**
* **Breakout level:** ₹16,200–₹16,500
* **Target:** ₹19,000+
* **Stop-loss (for traders):** Below ₹15,000 (previous swing low)
---
### ⚠️ Disclaimer
This is a technical analysis observation, not a trading recommendation. Please consult with a SEBI-registered advisor before making any investment decisions.
#### **1. Pattern Structure**
* The chart seems to be forming a **W-shaped base (Double Bottom)** or a **falling wedge / flag breakout**.
* The stock had made two significant lows, and now it's **attempting a breakout above the neckline/resistance** around the ₹16,000–₹16,200 zone.
* The **orange trendline** marks the falling resistance, which has now been **challenged**.
#### **2. Bullish Momentum**
* A **bullish engulfing candle** recently formed, indicating buyer strength.
* If the breakout sustains above the falling trendline and ₹16,500 zone, a **measured move towards ₹19,000+** looks very likely.
#### **3. Target Projection**
* Based on the **height of the pattern**, the vertical distance from the bottom to the neckline gives a **potential breakout target of ₹19,000**, which is also marked on the chart.
#### **4. Confirmation Levels**
* **Breakout level:** ₹16,200–₹16,500
* **Target:** ₹19,000+
* **Stop-loss (for traders):** Below ₹15,000 (previous swing low)
---
### ⚠️ Disclaimer
This is a technical analysis observation, not a trading recommendation. Please consult with a SEBI-registered advisor before making any investment decisions.
Thông báo miễn trừ trách nhiệm
Thông tin và ấn phẩm không có nghĩa là và không cấu thành, tài chính, đầu tư, kinh doanh, hoặc các loại lời khuyên hoặc khuyến nghị khác được cung cấp hoặc xác nhận bởi TradingView. Đọc thêm trong Điều khoản sử dụng.
Thông báo miễn trừ trách nhiệm
Thông tin và ấn phẩm không có nghĩa là và không cấu thành, tài chính, đầu tư, kinh doanh, hoặc các loại lời khuyên hoặc khuyến nghị khác được cung cấp hoặc xác nhận bởi TradingView. Đọc thêm trong Điều khoản sử dụng.