DECODED Technical Analysis DJI (DOW JONES)
What a remarkable historical chart
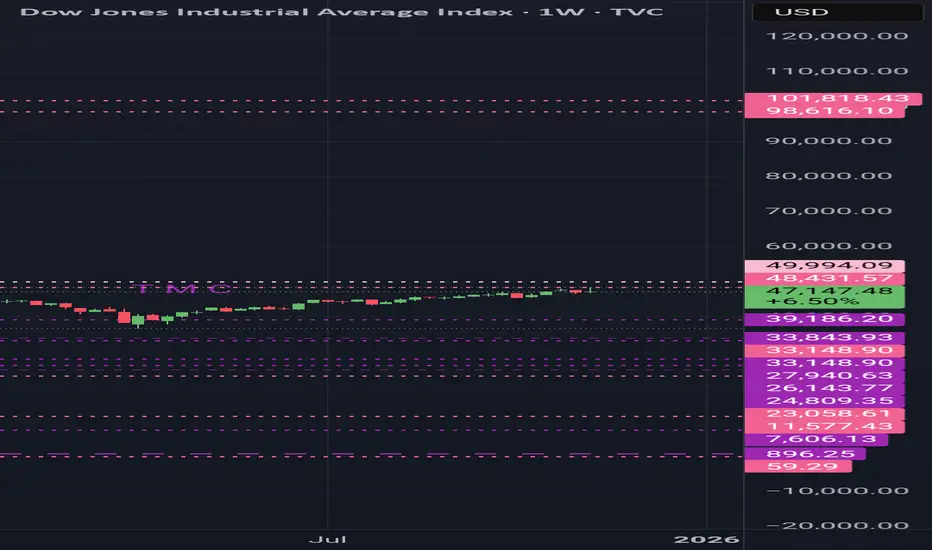
DJI, in its yearly first complete grand pattern, faces strong resistance at $48,431, the previous high, and $49,994, signaling a potential reversal. If not, corrections are at $33,843, $33,148, $27,940, $26,143, and $24,144
If the pattern restores, it could continue to test resistance at $98,616 and $101,818, completing its cycle in 2030/2031.
Lowest skip supports are at $23,000, $11,570, $1,210, and $59. These act like missing pillars; if price moves above them without testing, the structure becomes unstable, and sooner or later, the market will return to test them.
This message is for educational purposes only.
Always DYOR.
What a remarkable historical chart
DJI, in its yearly first complete grand pattern, faces strong resistance at $48,431, the previous high, and $49,994, signaling a potential reversal. If not, corrections are at $33,843, $33,148, $27,940, $26,143, and $24,144
If the pattern restores, it could continue to test resistance at $98,616 and $101,818, completing its cycle in 2030/2031.
Lowest skip supports are at $23,000, $11,570, $1,210, and $59. These act like missing pillars; if price moves above them without testing, the structure becomes unstable, and sooner or later, the market will return to test them.
This message is for educational purposes only.
Always DYOR.
Thông báo miễn trừ trách nhiệm
Thông tin và các ấn phẩm này không nhằm mục đích, và không cấu thành, lời khuyên hoặc khuyến nghị về tài chính, đầu tư, giao dịch hay các loại khác do TradingView cung cấp hoặc xác nhận. Đọc thêm tại Điều khoản Sử dụng.
Thông báo miễn trừ trách nhiệm
Thông tin và các ấn phẩm này không nhằm mục đích, và không cấu thành, lời khuyên hoặc khuyến nghị về tài chính, đầu tư, giao dịch hay các loại khác do TradingView cung cấp hoặc xác nhận. Đọc thêm tại Điều khoản Sử dụng.