________________________________________
💹 DOMS Industries Ltd (NSE: DOMS)
Sector: Consumer & Stationery Products | CMP: 2621.70 |
View: Multi-Month Symmetrical Triangle Breakout With Expanding Momentum
________________________________________
📊 Price Action:
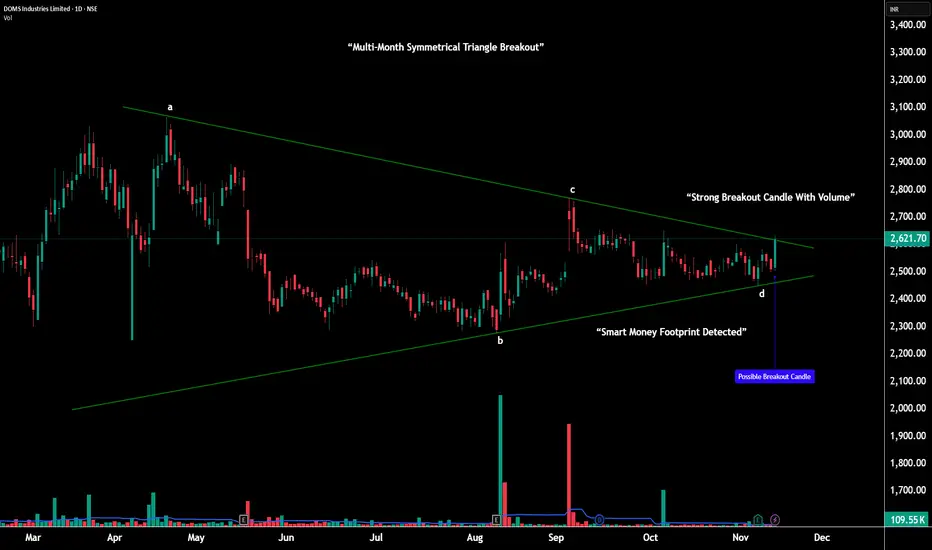
DOMS has spent the last five months forming a large symmetrical triangle — a volatility contraction structure marked by steady lower highs and higher lows from points A–B–C–D.
Throughout this period, buyers consistently defended the broader 2470–2500 demand belt, while sellers lost strength on every push lower.
This slow tightening shows how the market was preparing for a decisive move.
In the latest session, DOMS finally broke above the upper trendline, backed by a strong bullish range candle and a clear rise in volume, confirming the start of a fresh expansion phase.
________________________________________
📉 Chart Pattern Analysis – Large A–B–C–D Symmetrical Triangle:
This multi-month structure represents a major volatility compression following a previous uptrend — a classic continuation setup.
Point A: First major lower high
Point B: Deep anchor low
Point C: Lower high confirming supply weakening
Point D: Higher low showing demand strengthening
This clean A–B–C–D formation validates the symmetrical triangle perfectly.
As price approached the apex, volatility dried up, volume decreased, and the range narrowed — all ideal ingredients for a strong breakout.
The breakout candle now signals the end of compression and beginning of trend expansion.
________________________________________
📈 STWP Trading Analysis:
Bullish Breakout Zone: 2621.70 – 2633.20 | Stop Loss: 2498.60
The breakout candle shows high momentum and elevated volume, signaling institutional activity. Price has reclaimed all key moving averages with trend strength visible across 1H–1D–1W timeframes. As long as DOMS holds above the 2570–2590 structure zone, the bullish continuation bias remains active. Upside resistance levels can be used as potential levels of partial profit-taking, momentum checkpoints, and trend continuation targets.
________________________________________
🕯️ Candlestick Structure – Strong Bullish Breakout Candle:
The latest session printed a wide-range bullish candle, breaking through the upper triangle boundary decisively.
This type of candle — strong body, controlled wicks, clean range expansion — reflects conviction buying, not speculative spikes.
When this appears at the apex of a large compression pattern, it often marks the start of a new trending phase.
________________________________________
📏 Fibonacci Analysis:
Measured from swing low 2275.40 to swing high 2585.70:
38.2% @ 2393 → Secondary support
50% @ 2430 → Balanced support zone
61.8% @ 2467 → Strong golden zone (defended repeatedly)
The rebound from the 61.8% area aligns with the D-point of the triangle — reinforcing the structural validity and strengthening the breakout.
________________________________________
🧭 STWP Support & Resistance:
Resistances: 2667 | 2713 | 2794
Supports: 2540 | 2459 | 2413
The 2470–2500 region remains a major demand base, where the stock formed its higher lows at point D.
Immediate supply lies near 2667–2713, the first test zone after the breakout.
________________________________________
📊 STWP Volume & Technical Setup:
Volume climbed to 109.55K, significantly higher than recent averages — showing accumulation on the breakout.
RSI at 59 and Stochastic at 67 suggest healthy momentum with room for continuation.
MACD structure remains bullish, and multi-timeframe trend strength is intact.
Trend Direction: UPTREND | Volume Confirmation: Strong Buying Activity
________________________________________
🧩 STWP Summary View:
Momentum: Strong
Trend: Bullish
Risk: Moderate
Volume: High
DOMS has broken out of a large multi-month symmetrical triangle, a pattern known for initiating strong directional moves once volatility expands.
The structure remains bullish above 2570–2590, with continuation potential toward 2667 → 2713 → 2794 in the coming sessions.
________________________________________
⚠️ Disclosure & Disclaimer – Please Read Carefully
This analysis is for educational purposes only and should not be treated as investment advice.
I am not a SEBI-registered financial advisor.
Trading carries risk — use stop-loss, risk limits, and disciplined position sizing.
Please consult a SEBI-registered adviser before making trading decisions.
________________________________________
Position Status: No active position in (DOMS) at the time of this analysis.
Data Source: TradingView & NSE India
________________________________________
💬 Found this useful?
🔼 Boost this post to help more traders learn structured analysis
💭 Share your thoughts — does this breakout hold the strength for trend expansion?
🔁 Share with traders who study breakout structures
👉 Follow for more clean, price-action-driven institutional breakdowns
🚀 Stay Calm. Stay Clean. Trade With Patience.
Trade Smart | Learn Zones | Be Self-Reliant 📊
________________________________________
💹 DOMS Industries Ltd (NSE: DOMS)
Sector: Consumer & Stationery Products | CMP: 2621.70 |
View: Multi-Month Symmetrical Triangle Breakout With Expanding Momentum
________________________________________
📊 Price Action:
DOMS has spent the last five months forming a large symmetrical triangle — a volatility contraction structure marked by steady lower highs and higher lows from points A–B–C–D.
Throughout this period, buyers consistently defended the broader 2470–2500 demand belt, while sellers lost strength on every push lower.
This slow tightening shows how the market was preparing for a decisive move.
In the latest session, DOMS finally broke above the upper trendline, backed by a strong bullish range candle and a clear rise in volume, confirming the start of a fresh expansion phase.
________________________________________
📉 Chart Pattern Analysis – Large A–B–C–D Symmetrical Triangle:
This multi-month structure represents a major volatility compression following a previous uptrend — a classic continuation setup.
Point A: First major lower high
Point B: Deep anchor low
Point C: Lower high confirming supply weakening
Point D: Higher low showing demand strengthening
This clean A–B–C–D formation validates the symmetrical triangle perfectly.
As price approached the apex, volatility dried up, volume decreased, and the range narrowed — all ideal ingredients for a strong breakout.
The breakout candle now signals the end of compression and beginning of trend expansion.
________________________________________
📈 STWP Trading Analysis:
Bullish Breakout Zone: 2621.70 – 2633.20 | Stop Loss: 2498.60
The breakout candle shows high momentum and elevated volume, signaling institutional activity. Price has reclaimed all key moving averages with trend strength visible across 1H–1D–1W timeframes. As long as DOMS holds above the 2570–2590 structure zone, the bullish continuation bias remains active. Upside resistance levels can be used as potential levels of partial profit-taking, momentum checkpoints, and trend continuation targets.
________________________________________
🕯️ Candlestick Structure – Strong Bullish Breakout Candle:
The latest session printed a wide-range bullish candle, breaking through the upper triangle boundary decisively.
This type of candle — strong body, controlled wicks, clean range expansion — reflects conviction buying, not speculative spikes.
When this appears at the apex of a large compression pattern, it often marks the start of a new trending phase.
________________________________________
📏 Fibonacci Analysis:
Measured from swing low 2275.40 to swing high 2585.70:
38.2% @ 2393 → Secondary support
50% @ 2430 → Balanced support zone
61.8% @ 2467 → Strong golden zone (defended repeatedly)
The rebound from the 61.8% area aligns with the D-point of the triangle — reinforcing the structural validity and strengthening the breakout.
________________________________________
🧭 STWP Support & Resistance:
Resistances: 2667 | 2713 | 2794
Supports: 2540 | 2459 | 2413
The 2470–2500 region remains a major demand base, where the stock formed its higher lows at point D.
Immediate supply lies near 2667–2713, the first test zone after the breakout.
________________________________________
📊 STWP Volume & Technical Setup:
Volume climbed to 109.55K, significantly higher than recent averages — showing accumulation on the breakout.
RSI at 59 and Stochastic at 67 suggest healthy momentum with room for continuation.
MACD structure remains bullish, and multi-timeframe trend strength is intact.
Trend Direction: UPTREND | Volume Confirmation: Strong Buying Activity
________________________________________
🧩 STWP Summary View:
Momentum: Strong
Trend: Bullish
Risk: Moderate
Volume: High
DOMS has broken out of a large multi-month symmetrical triangle, a pattern known for initiating strong directional moves once volatility expands.
The structure remains bullish above 2570–2590, with continuation potential toward 2667 → 2713 → 2794 in the coming sessions.
________________________________________
⚠️ Disclosure & Disclaimer – Please Read Carefully
This analysis is for educational purposes only and should not be treated as investment advice.
I am not a SEBI-registered financial advisor.
Trading carries risk — use stop-loss, risk limits, and disciplined position sizing.
Please consult a SEBI-registered adviser before making trading decisions.
________________________________________
Position Status: No active position in (DOMS) at the time of this analysis.
Data Source: TradingView & NSE India
________________________________________
💬 Found this useful?
🔼 Boost this post to help more traders learn structured analysis
💭 Share your thoughts — does this breakout hold the strength for trend expansion?
🔁 Share with traders who study breakout structures
👉 Follow for more clean, price-action-driven institutional breakdowns
🚀 Stay Calm. Stay Clean. Trade With Patience.
Trade Smart | Learn Zones | Be Self-Reliant 📊
________________________________________
STWP | Mentor & Demand-Supply Specialist | Empowering traders through structured learning |
simpletradewithpatience.com
Community: chat.whatsapp.com/BEYz0tkqP0fJPBCWf59uel
wa.me/message/6IOPHGOXMGZ4N1
Educational Only
simpletradewithpatience.com
Community: chat.whatsapp.com/BEYz0tkqP0fJPBCWf59uel
wa.me/message/6IOPHGOXMGZ4N1
Educational Only
Thông báo miễn trừ trách nhiệm
Thông tin và các ấn phẩm này không nhằm mục đích, và không cấu thành, lời khuyên hoặc khuyến nghị về tài chính, đầu tư, giao dịch hay các loại khác do TradingView cung cấp hoặc xác nhận. Đọc thêm tại Điều khoản Sử dụng.