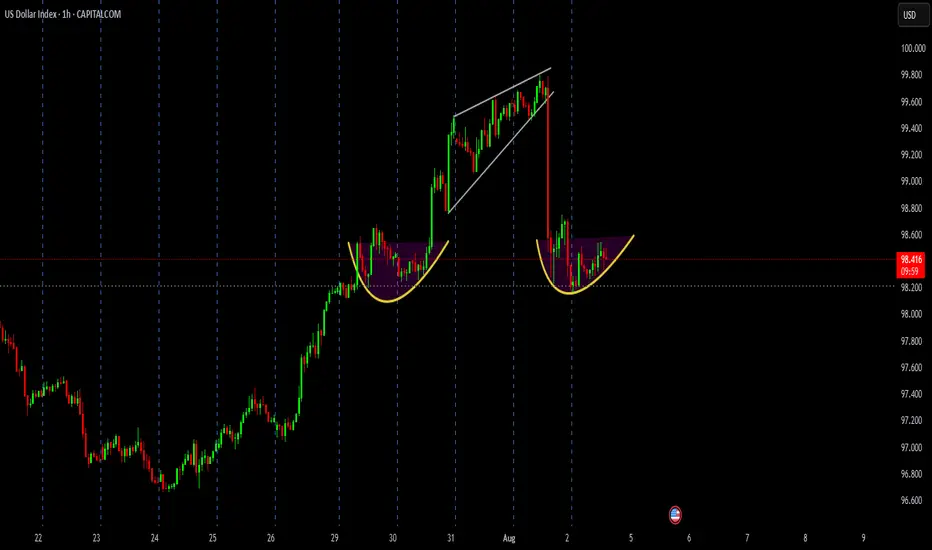
📌 Chart Patterns in Focus:
1️⃣ Cup & Handle Formation (29–31 July):
Bullish reversal pattern spotted
Price broke out sharply upwards after the handle consolidation
2️⃣ Rising Wedge Breakdown (31 July – 1 Aug):
Bearish pattern triggered heavy selling
Sharp red candle confirms strong bearish pressure
3️⃣ New Cup Base Forming (2 Aug – Present):
Price consolidating after drop
Another Cup & Handle formation in progress
Break above neckline near 98.60 could trigger next bullish wave
💡 What to Watch Next:
Breakout above 98.60 = Possible upside continuation
Failure to breakout = Range-bound or bearish retest of 98.00
📍Current Price: 98.425
⏱️ Timeframe: 1 Hour
📈 Bias: Cautiously Bullish (if neckline breaks)
📉 Risk: Another rejection may lead to 97.80 zone retest
🔔 Stay tuned for breakout confirmation before positioning!
#DXY #USDIndex #TechnicalAnalysis #ChartPatterns #ForexTrading #PriceAction #CupAndHandle #RisingWedge #SmartTrading
Thông báo miễn trừ trách nhiệm
Thông tin và ấn phẩm không có nghĩa là và không cấu thành, tài chính, đầu tư, kinh doanh, hoặc các loại lời khuyên hoặc khuyến nghị khác được cung cấp hoặc xác nhận bởi TradingView. Đọc thêm trong Điều khoản sử dụng.
Thông báo miễn trừ trách nhiệm
Thông tin và ấn phẩm không có nghĩa là và không cấu thành, tài chính, đầu tư, kinh doanh, hoặc các loại lời khuyên hoặc khuyến nghị khác được cung cấp hoặc xác nhận bởi TradingView. Đọc thêm trong Điều khoản sử dụng.