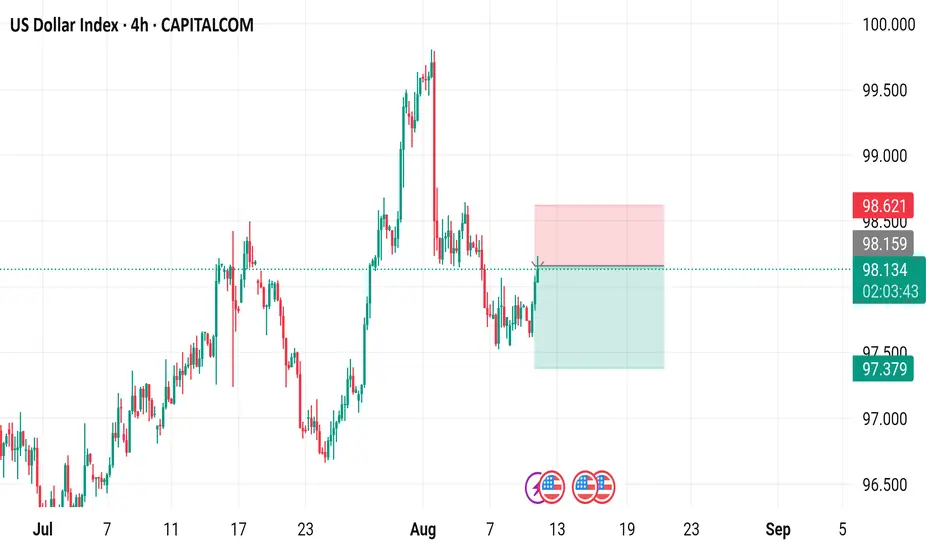
4-hour chart of the US Dollar Index (DXY) from CAPITALCOM. The chart shows the price movement of the DXY from early July to early September. The current price is 98.131 with a 0.28% increase. The chart features a candlestick pattern with green (upward movement) and red (downward movement) bars. A sell signal is indicated at 98.132, and a buy signal is at 98.186. The chart also includes highlighted zones (red and green rectangles) indicating potential trading ranges or areas of interest between approximately 98.621 and 97.379.
Đóng lệnh: đạt mục tiêu
Target achieved Thông báo miễn trừ trách nhiệm
Thông tin và ấn phẩm không có nghĩa là và không cấu thành, tài chính, đầu tư, kinh doanh, hoặc các loại lời khuyên hoặc khuyến nghị khác được cung cấp hoặc xác nhận bởi TradingView. Đọc thêm trong Điều khoản sử dụng.
Thông báo miễn trừ trách nhiệm
Thông tin và ấn phẩm không có nghĩa là và không cấu thành, tài chính, đầu tư, kinh doanh, hoặc các loại lời khuyên hoặc khuyến nghị khác được cung cấp hoặc xác nhận bởi TradingView. Đọc thêm trong Điều khoản sử dụng.